Articles
Notes on valuation, wealth, and the gauges.
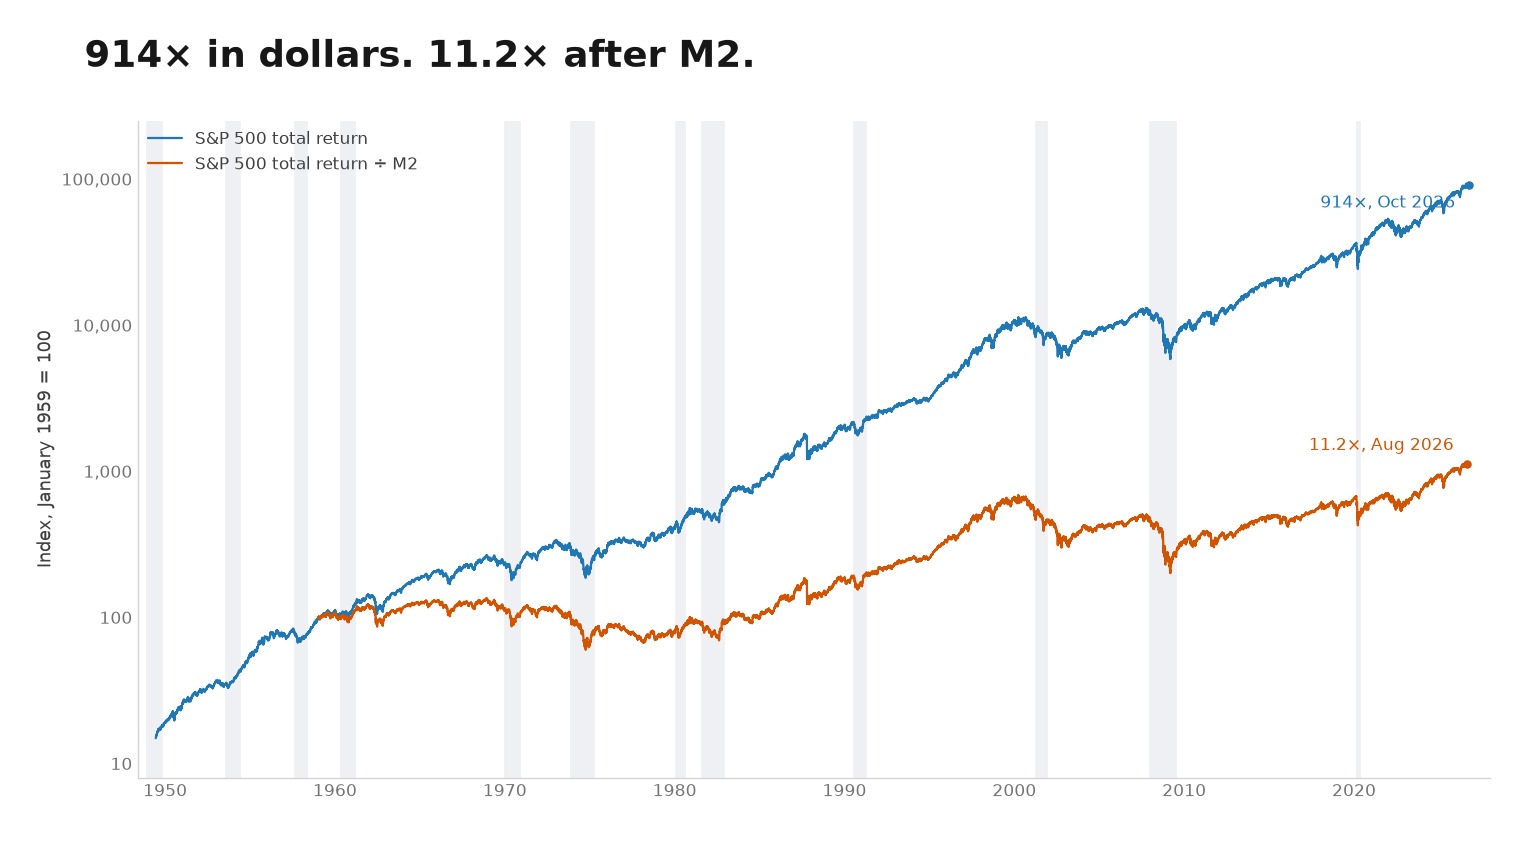
Bull markets are 84% of the time. Divided by M2, 49%.
Since June 1949 the S&P 500 has spent 84% of its time in a bull market, averaging 5.4 years and +253%. Divide the index by M2 and bulls are 49% of the time, average 3.0 years and +89%, and December 1961 to August 1982 is one bear.
October 2, 2026
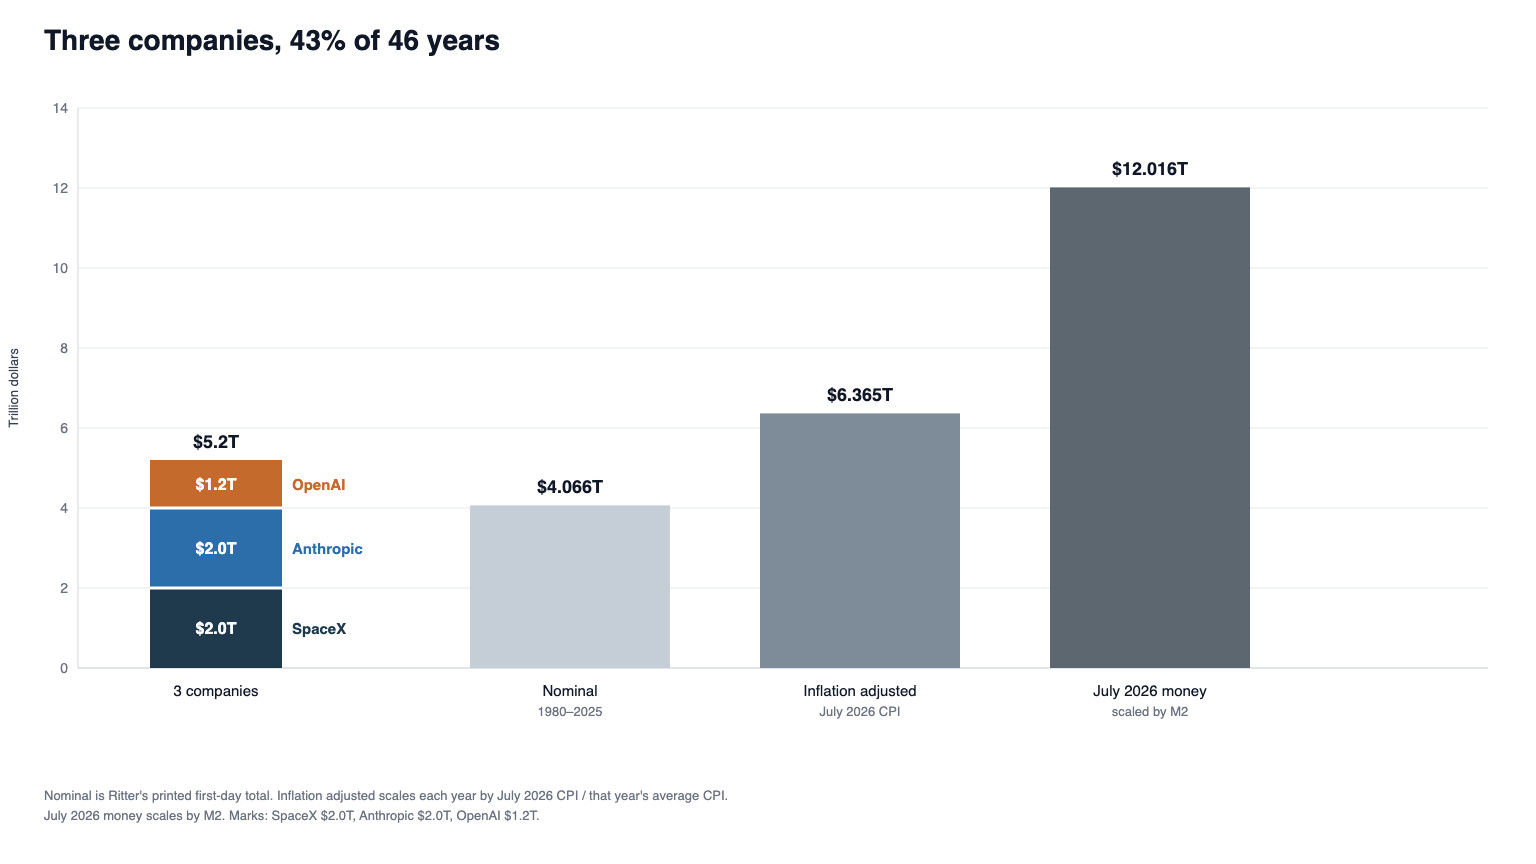
Three companies are 43% of every tech IPO since 1980
SpaceX, Anthropic, and OpenAI are marked at $5.2 trillion, 43.3% of every U.S. tech IPO since 1980 in July 2026 money.
September 23, 2026
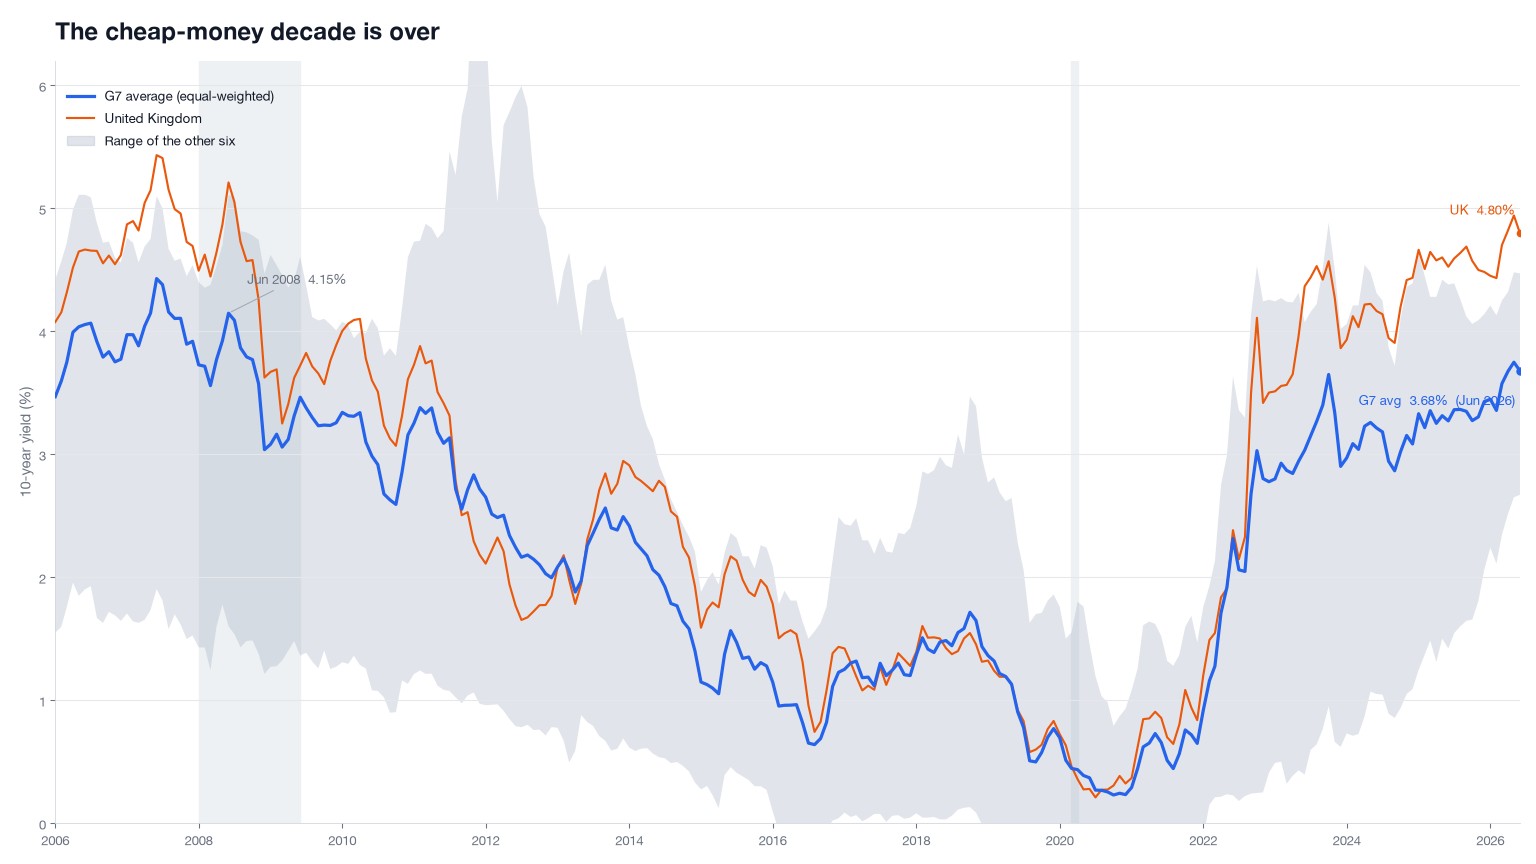
The G7 is paying 2008 rates. Stocks are not.
The seven G7 10-year yields average 4.08% today, last seen in the summer of 2008. The multiple is still priced for the decade after that.
September 15, 2026
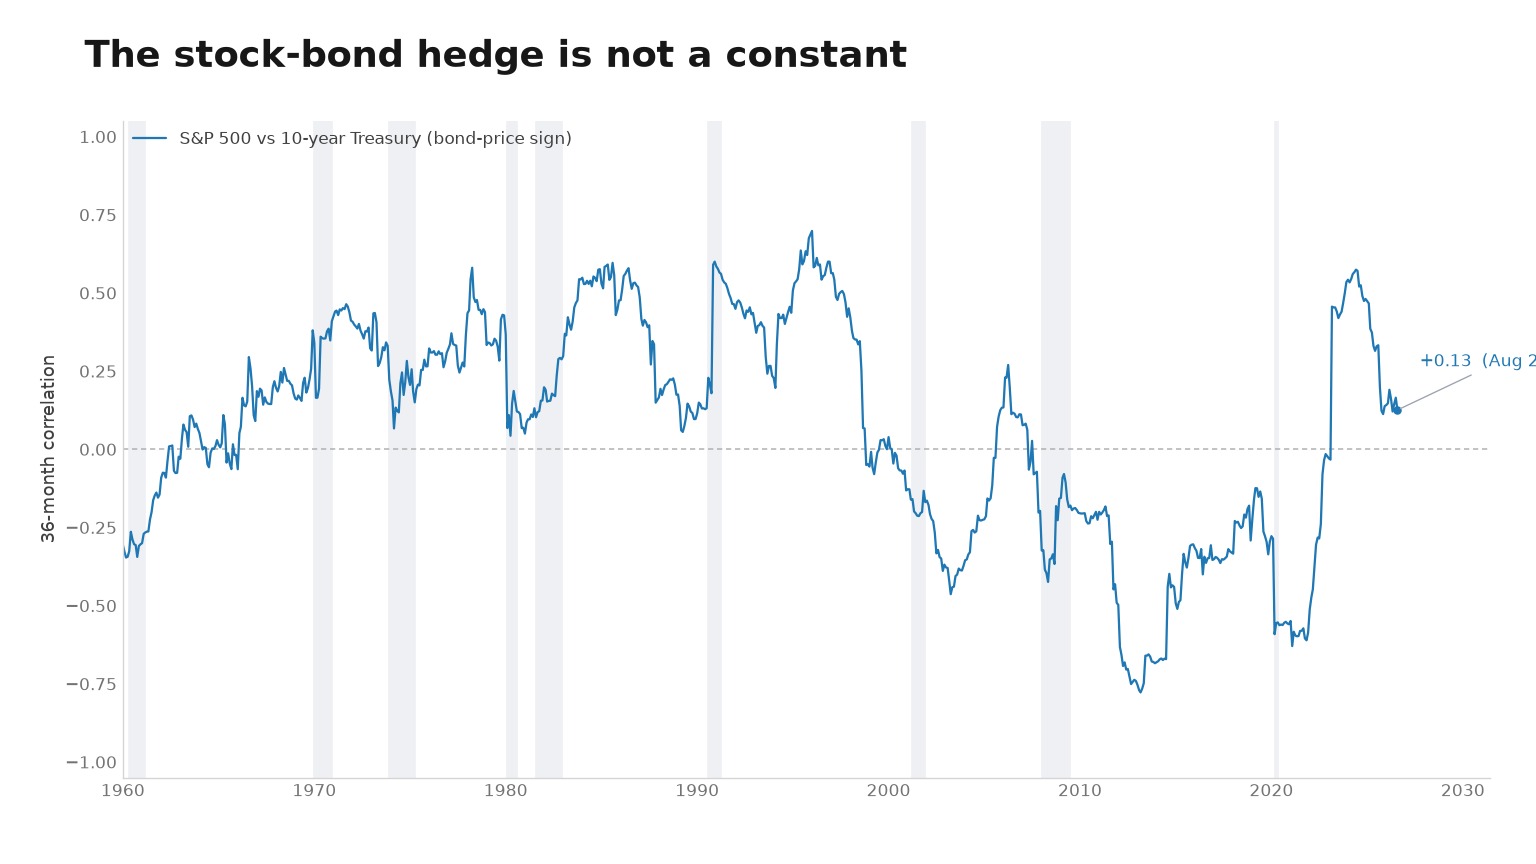
The same rate move is not the same signal
Wang splits stock returns into a Treasury-like duration piece and a payoff piece. Rates that fall in a recession cushion stocks. Rates that rise on growth news take some of the gain back. One yield is not one input.
September 10, 2026
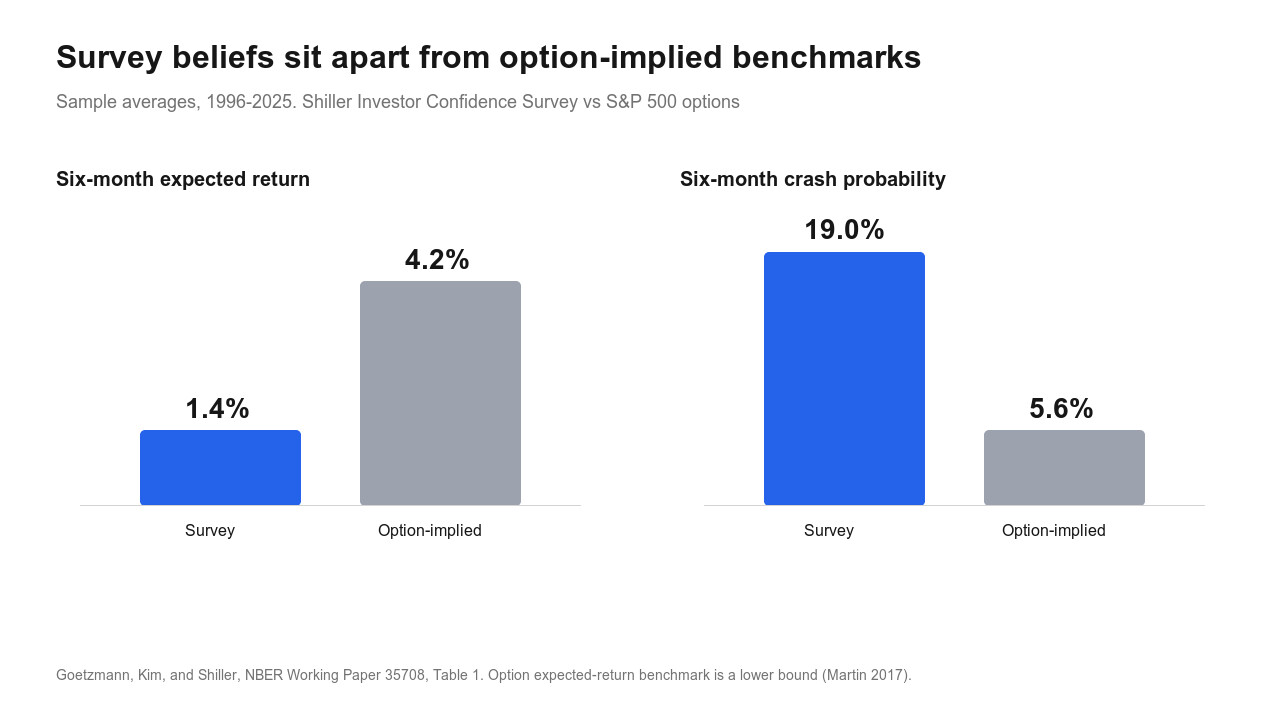
The survey is not the market
Survey averages mix people who left with people who set prices. The useful number is the gap versus options.
September 9, 2026
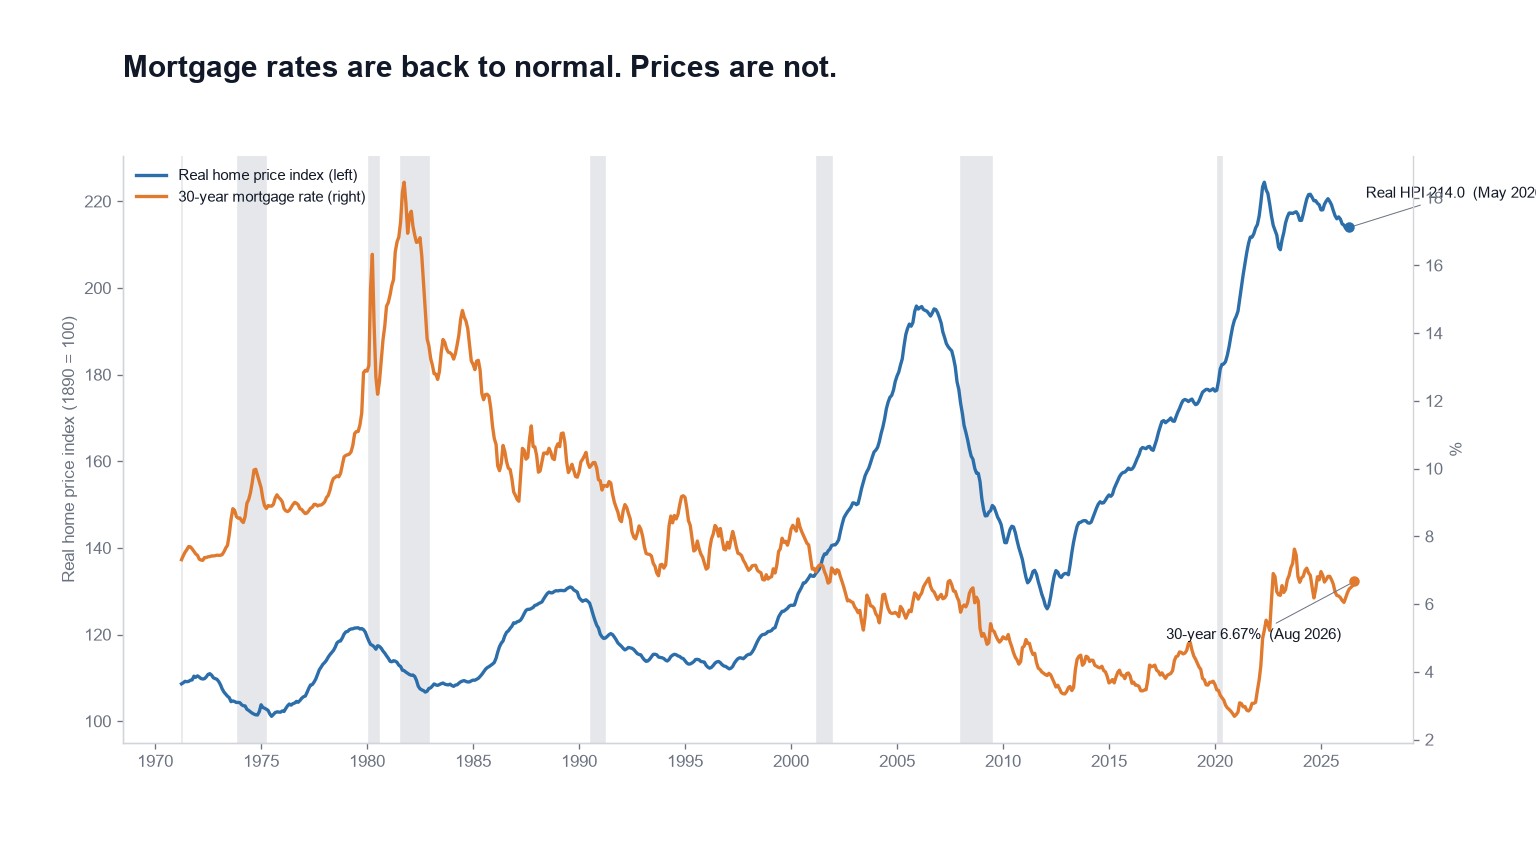
Mortgage rates are back to normal. Prices are not.
The 30-year mortgage is 6.66%, below its own 7.68% average. Real home prices are still 27.9% above a trailing 30-year mean.
September 1, 2026
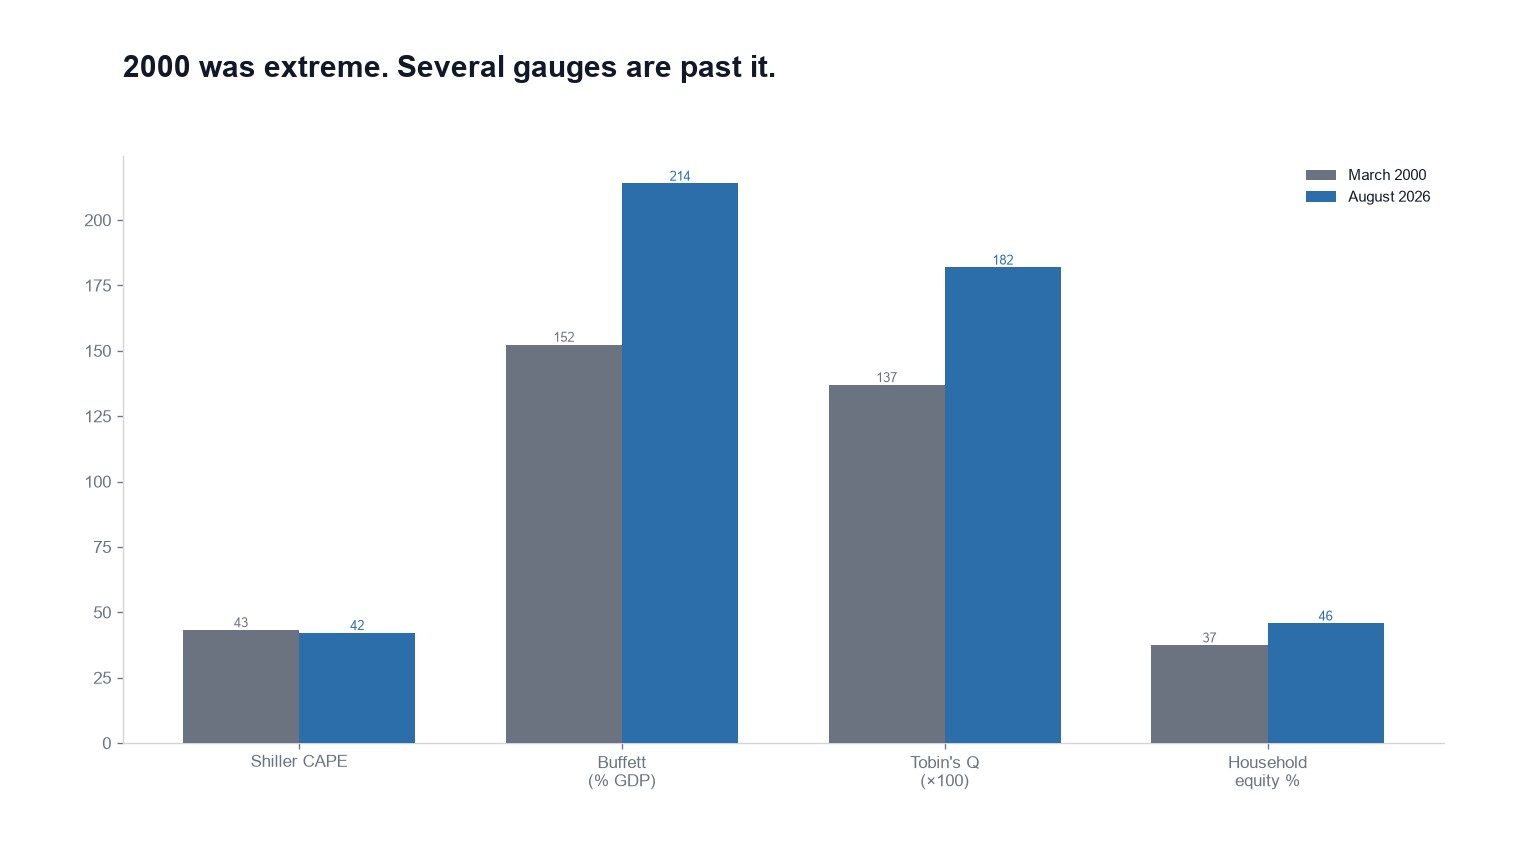
2000 answers one question, not four
CAPE sits just under the dot-com peak. Buffett, Tobin's Q and household equity have all passed it. One column matches, three are worse.
August 27, 2026
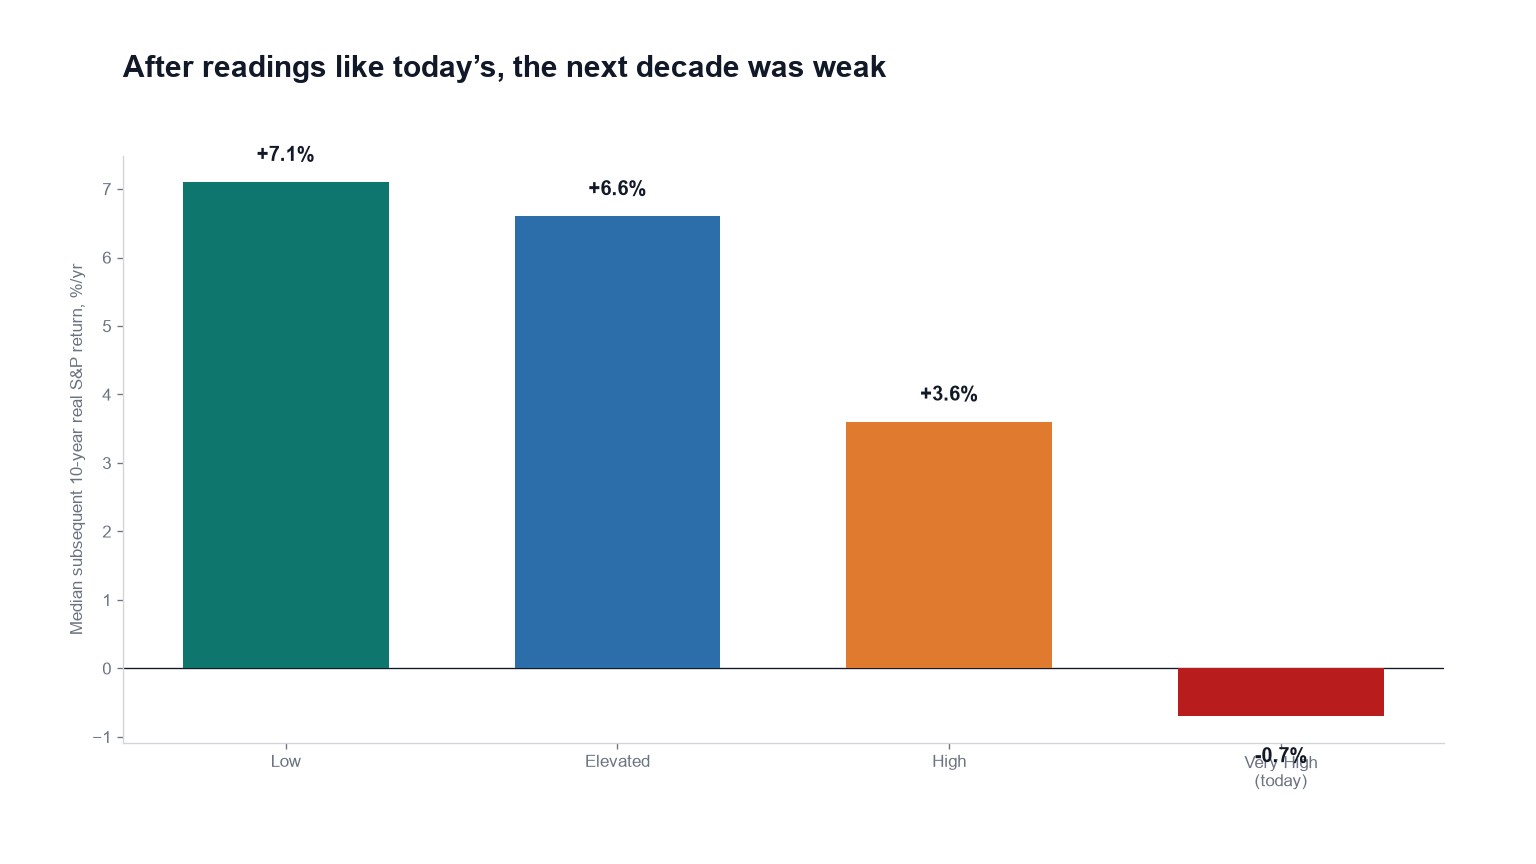
What the following ten years looked like
Months in the Very High bucket were followed by a median real S&P return of −0.7% a year for a decade, and 53% of those decades lost purchasing power.
August 26, 2026
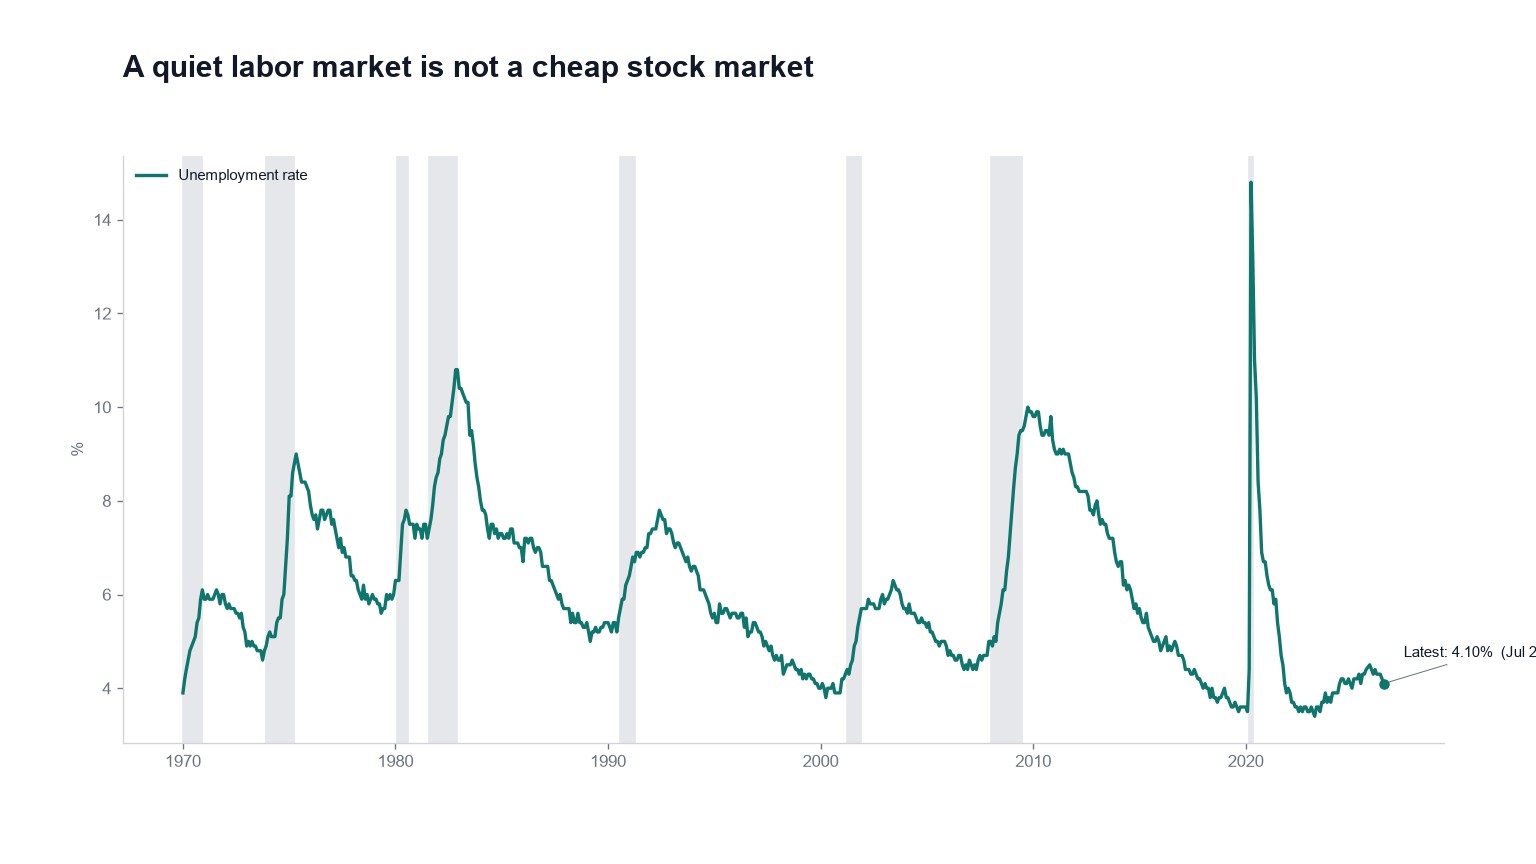
A good job market doesn't make stocks cheap
Unemployment is 4.1%. That tells you the expansion is intact. It tells you nothing about a 42× CAPE, a 214% Buffett Indicator, or a 93% composite.
August 24, 2026
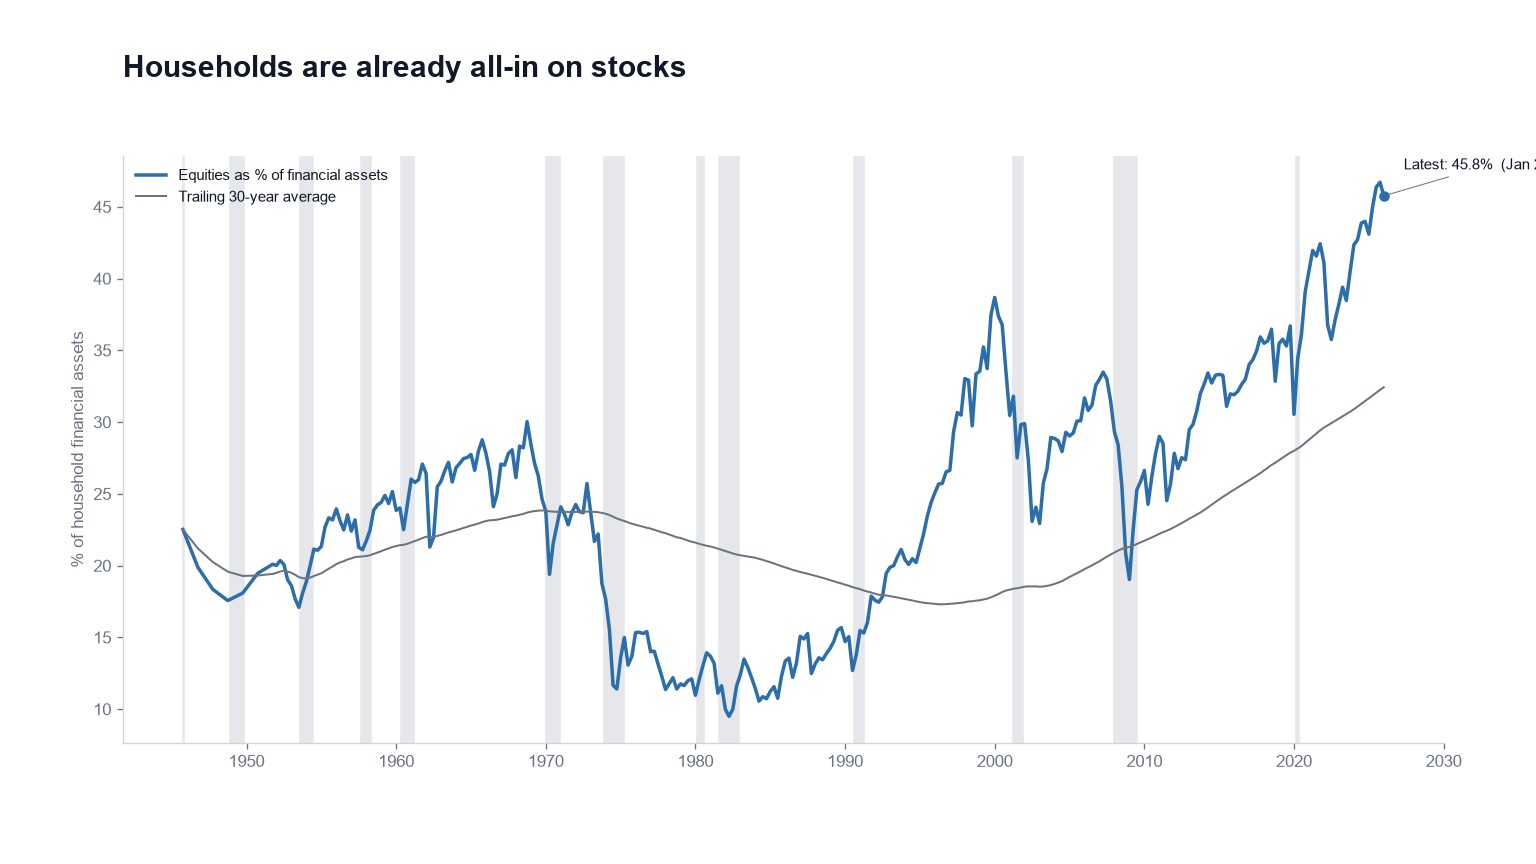
Households already bought
Equities are 45.8% of household financial assets, a 99th-percentile reading. This measures what people own rather than how they feel, which is why it votes.
August 21, 2026
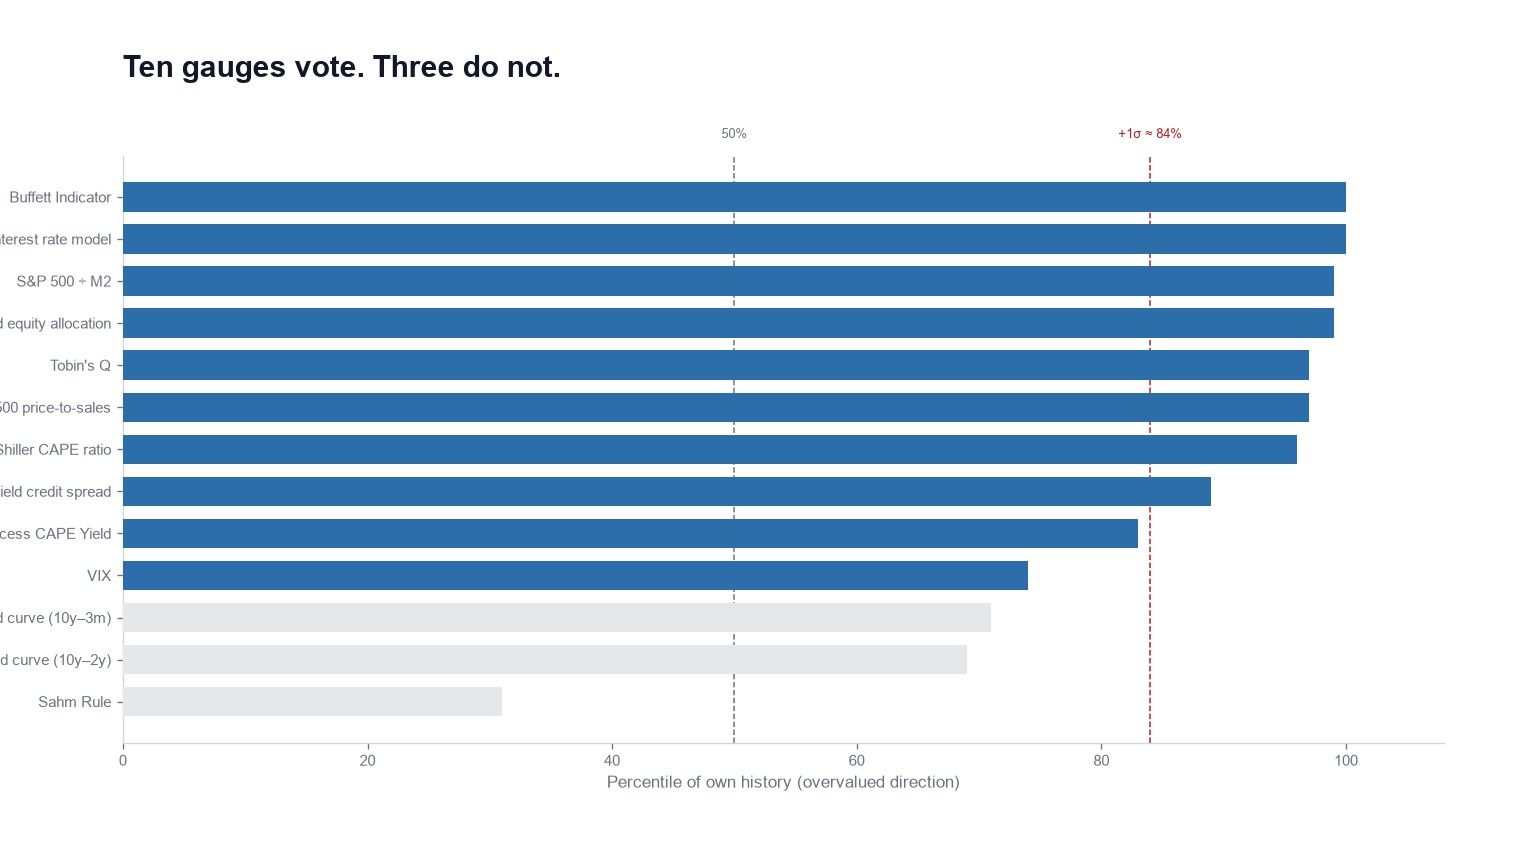
How the 93% is calculated
Ten percentiles, equally weighted, with the two low-bad gauges inverted and the three recession gauges left out. The whole method fits in a paragraph.
August 18, 2026
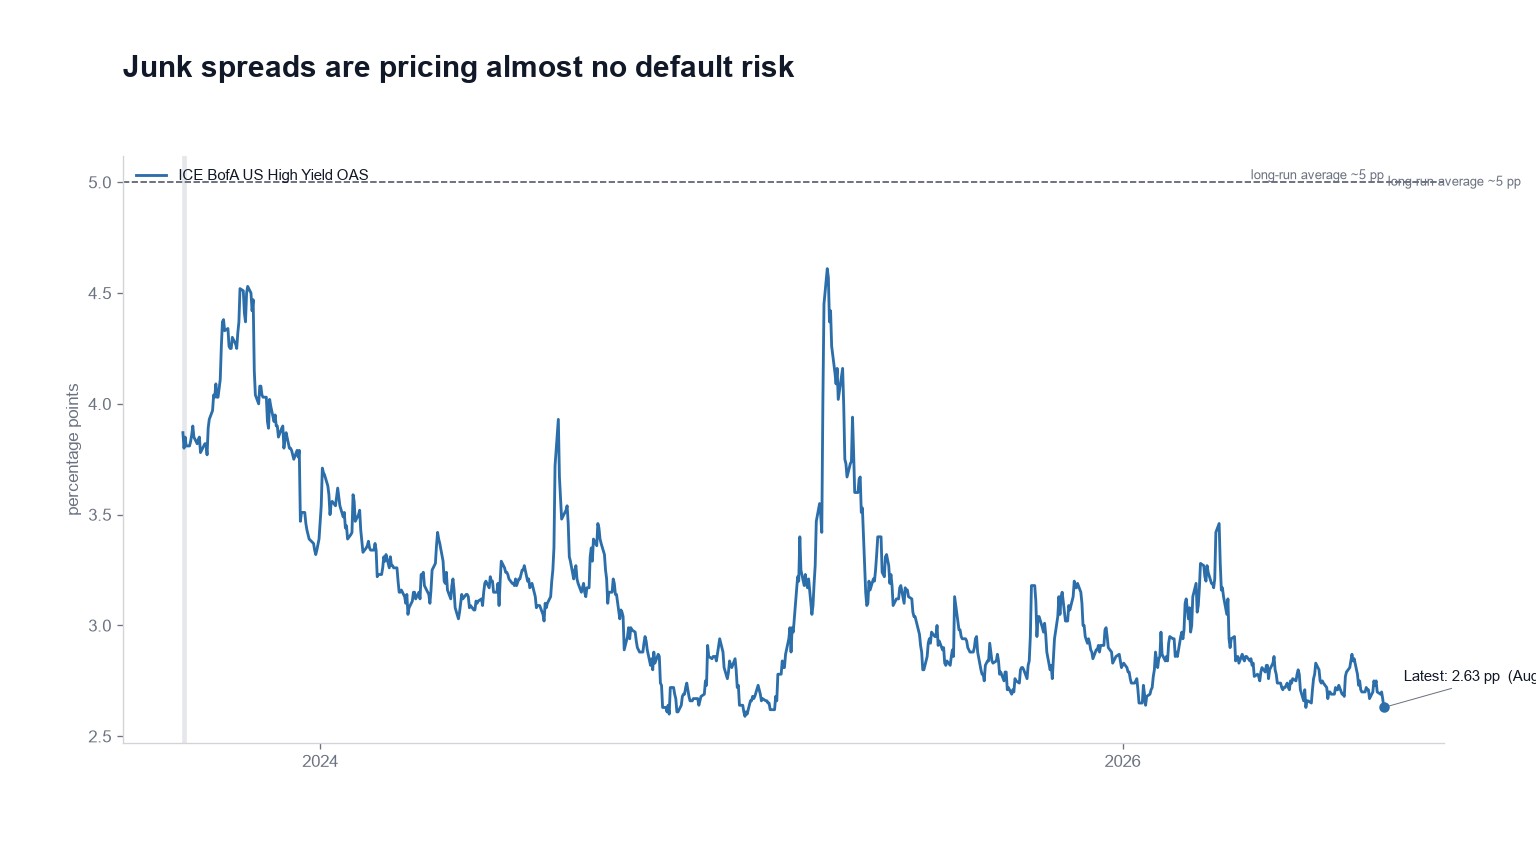
Lenders have stopped charging for default risk
High-yield spreads are 2.63 points against a 5-point average. On this gauge the small number is the dangerous one, and it's currently small.
August 17, 2026
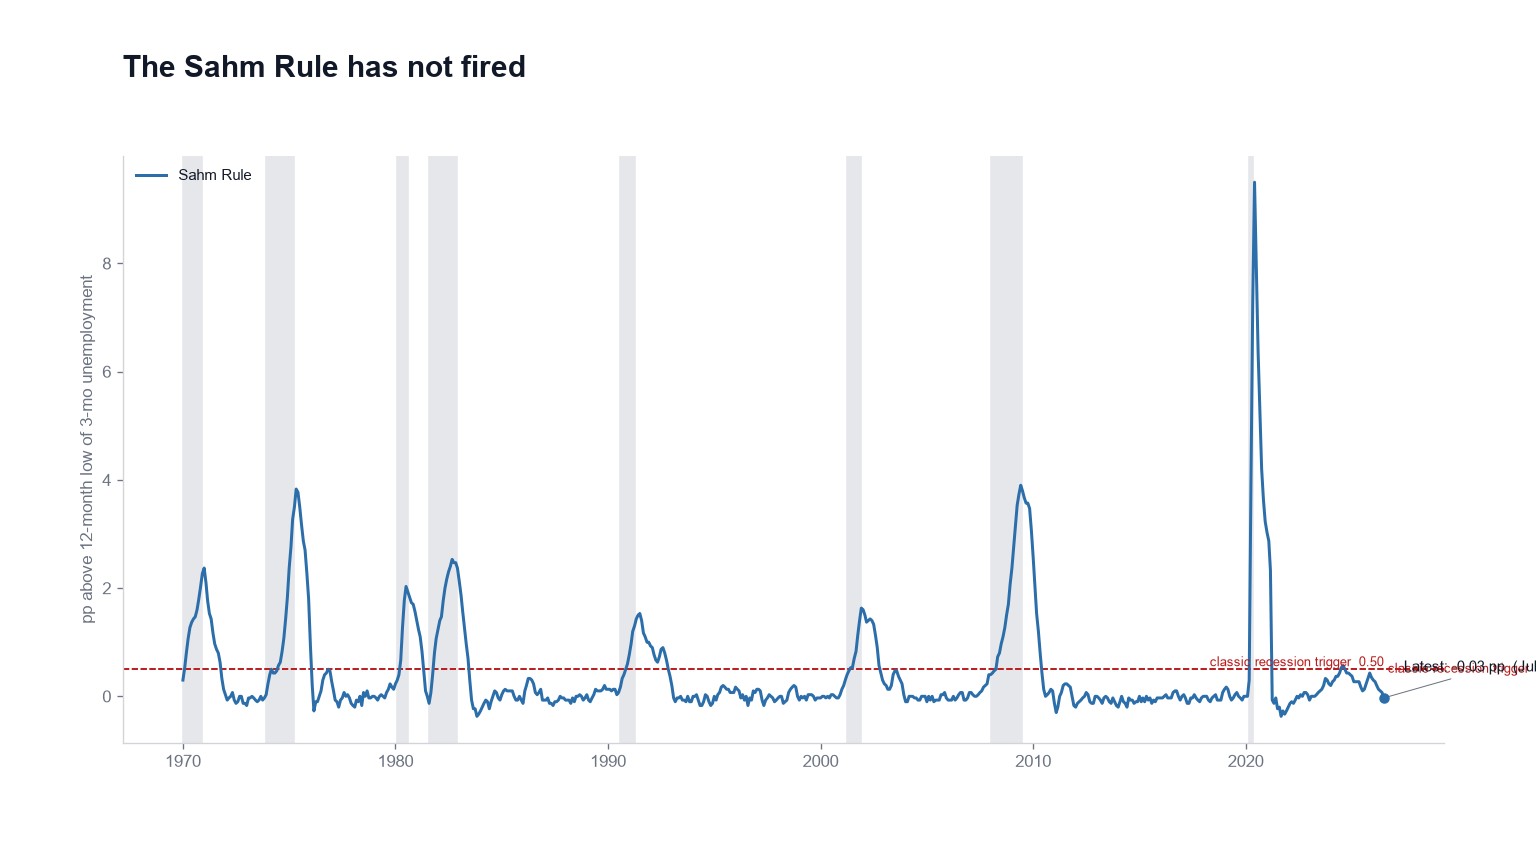
The Sahm Rule is quiet. It isn't looking at stocks.
Sahm reads 0 against a 0.50 trigger. It's a real-time check on the labor market, and it has no opinion whatsoever about what you're paying for equities.
August 16, 2026
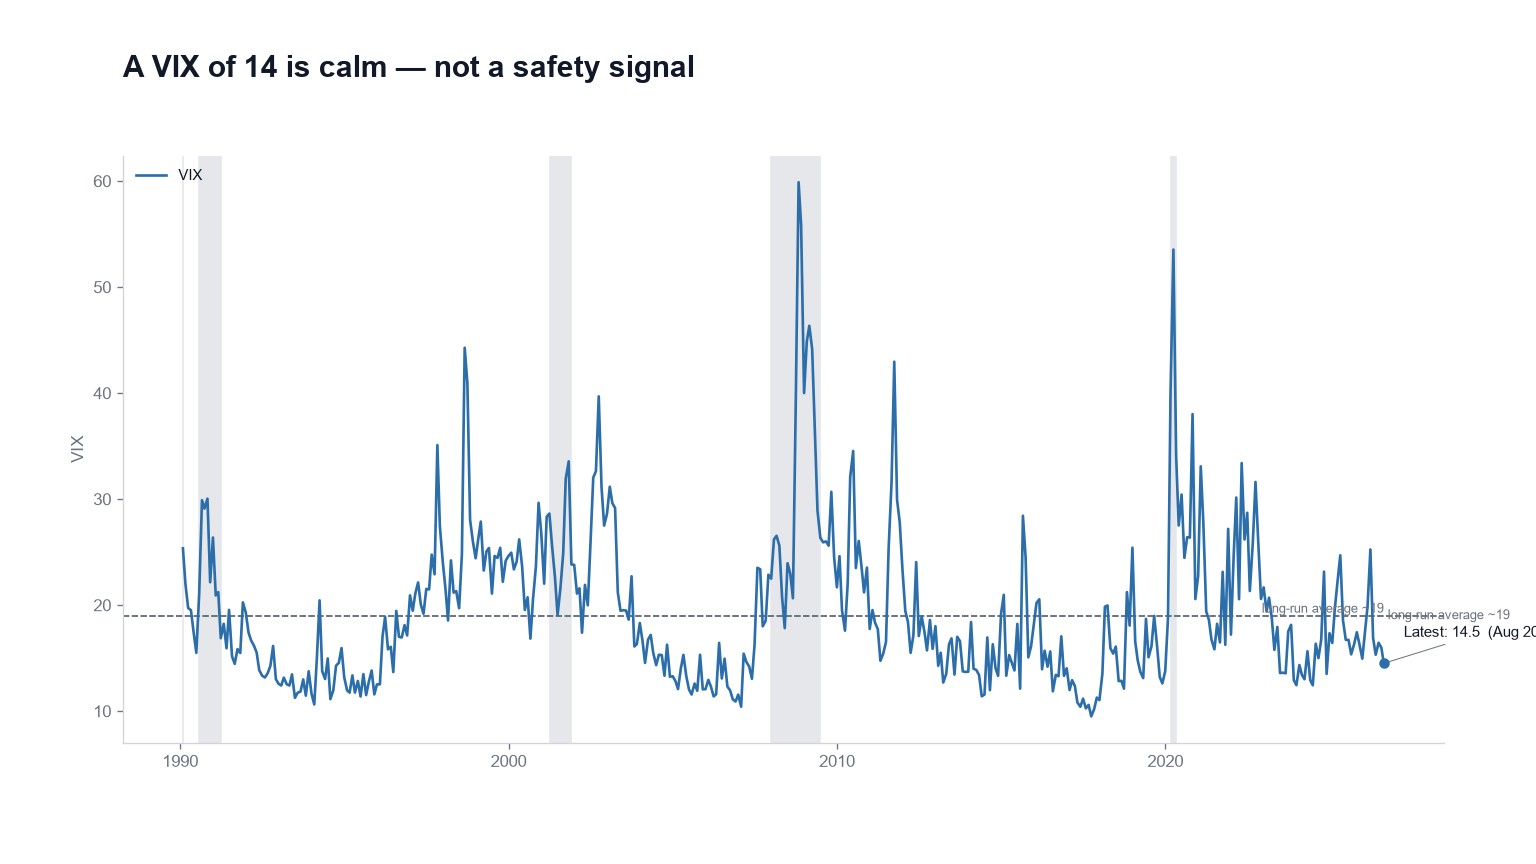
What a VIX of 14 actually tells you
The VIX closed at 14.51, well under its long-run average of 19. It measures the price of insurance, and cheap insurance has never meant the house won't burn.
August 14, 2026
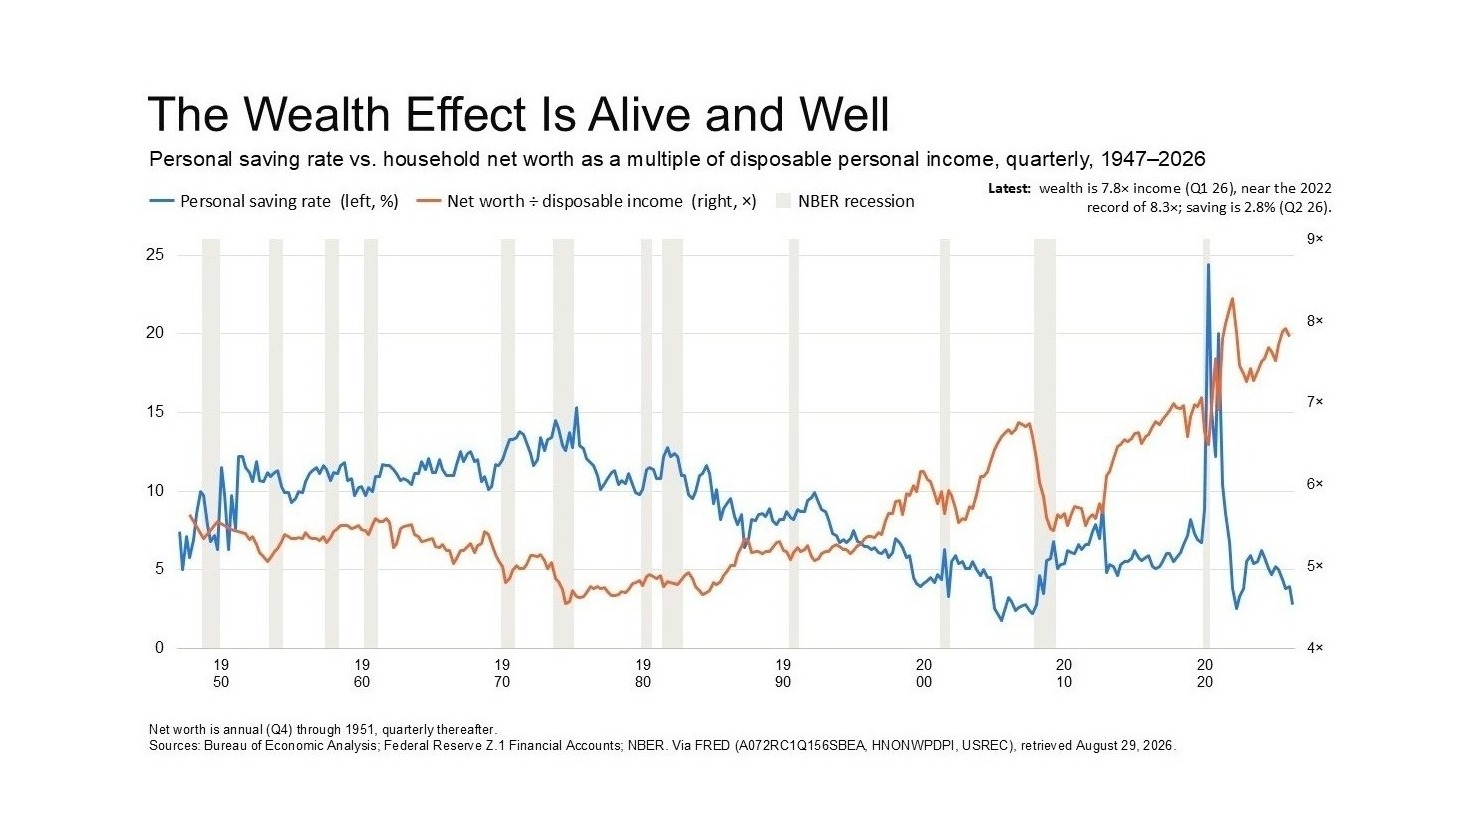
The spending is coming from the people who own the shares
Net worth rises, saving falls, spending rises. The wealth doing that work sits in the same equities our gauges already call expensive.
August 10, 2026
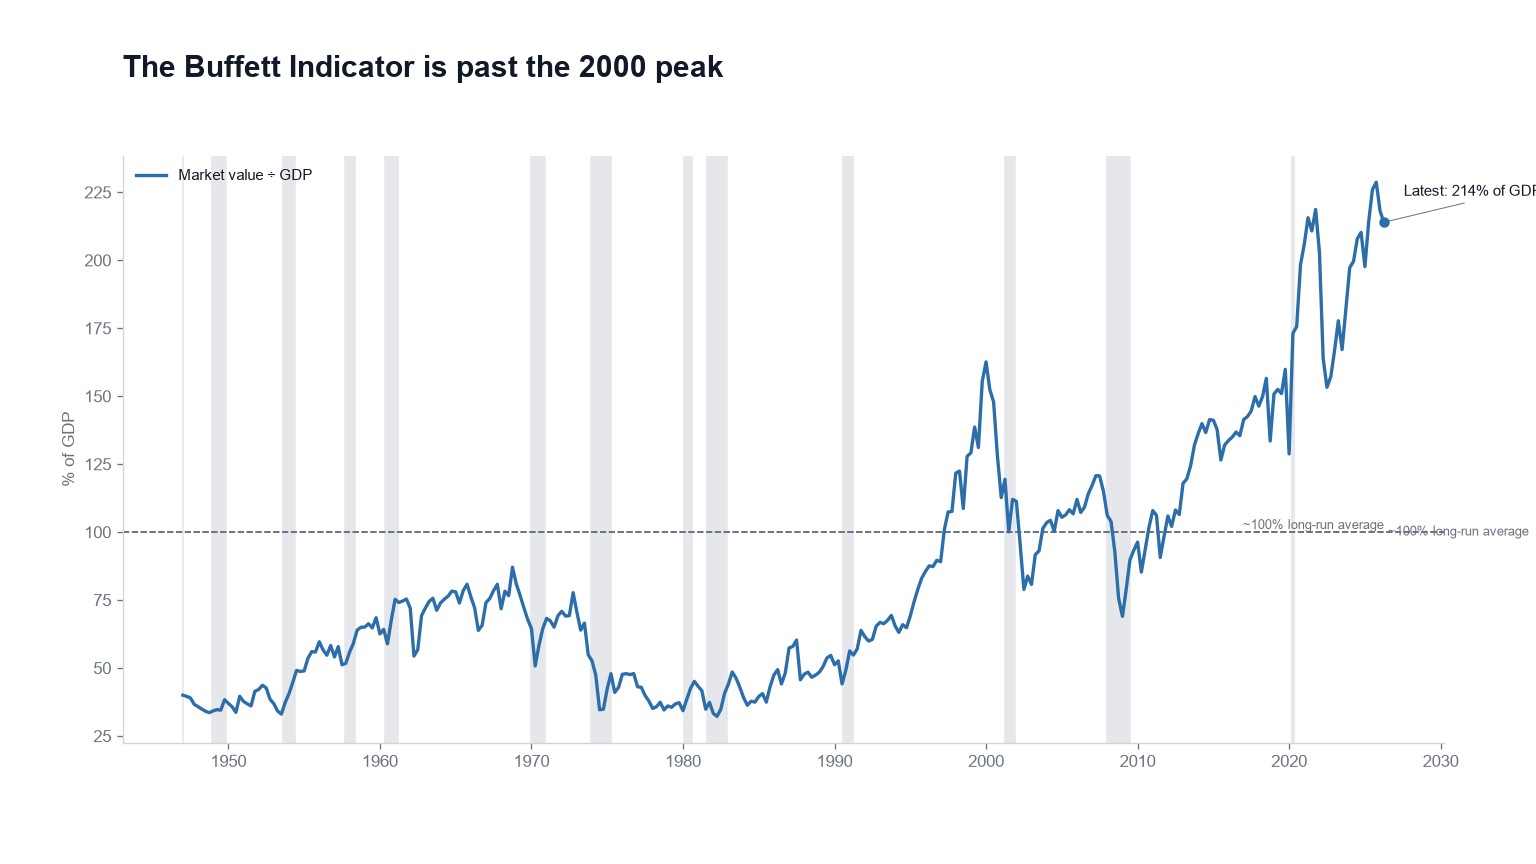
The market costs more than two years of American output
US stocks are worth 214% of GDP, past both the 2000 and 2021 peaks. Globalization explains part of the climb, and we adjust for it. It doesn't explain this.
August 8, 2026
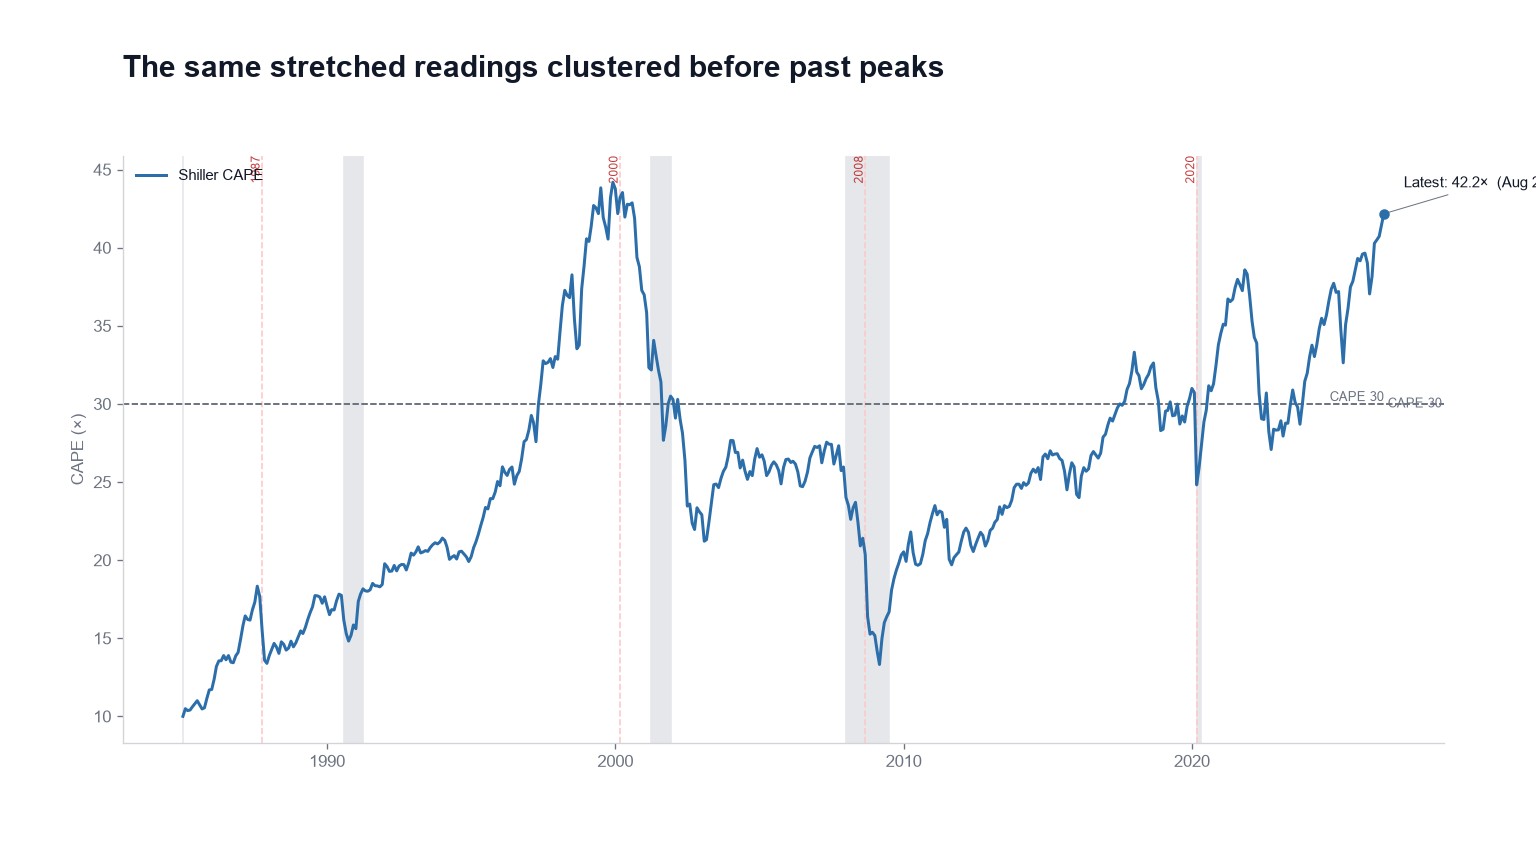
Extreme readings arrive in clusters
Since 1985, a CAPE above 30 has bunched into 2000, into 2021 and into now. Two of those clusters resolved badly. The third hasn't resolved.
August 7, 2026
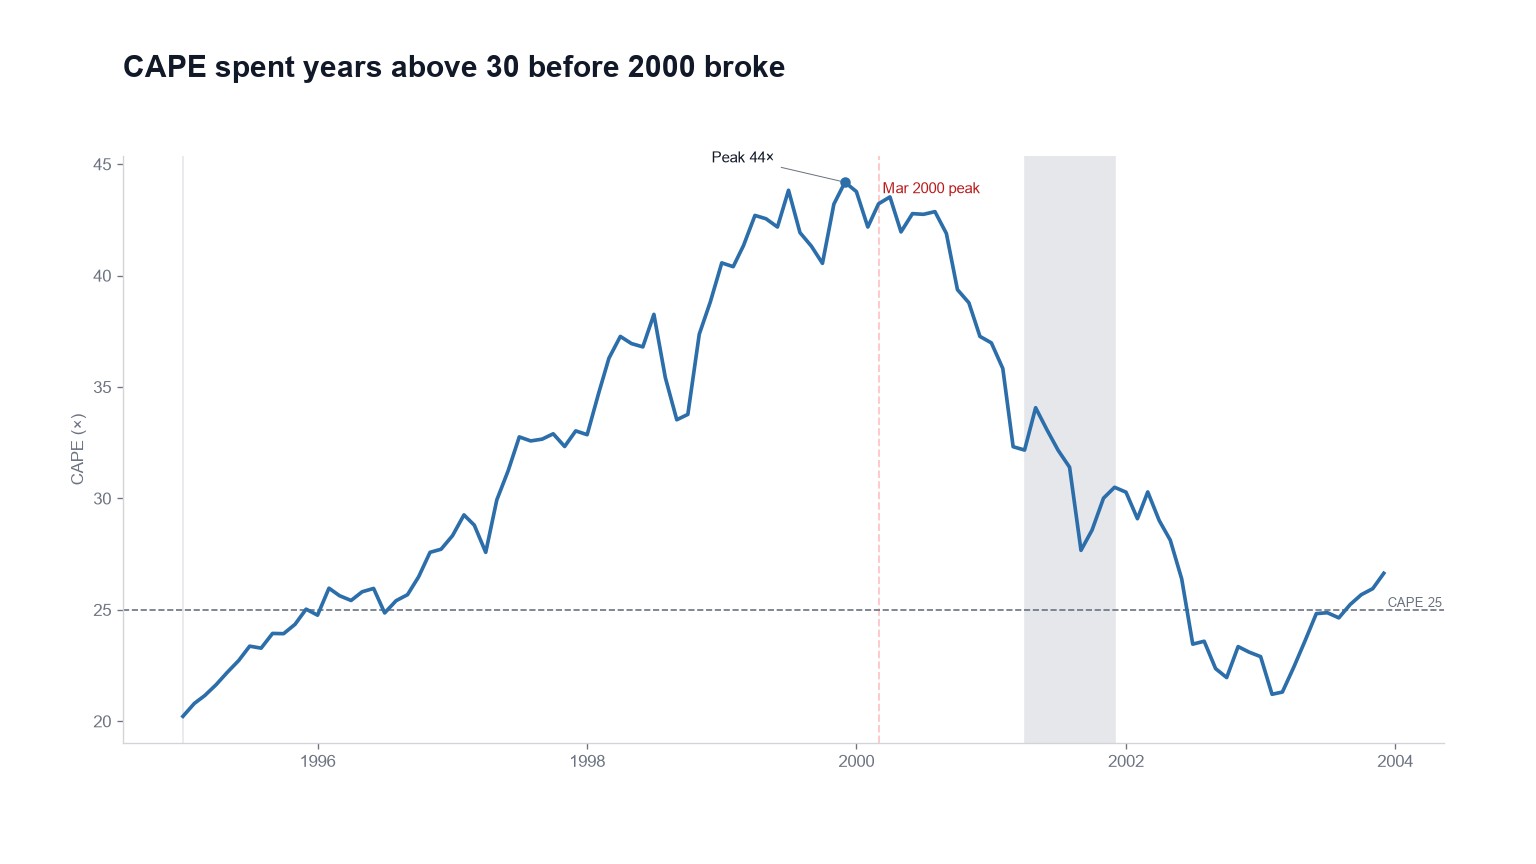
CAPE crossed 30 in 1997 and peaked in 2000
Three years of being right about valuation and wrong about everything that paid. High readings have meant weak decade returns. They have never set a date.
August 2, 2026
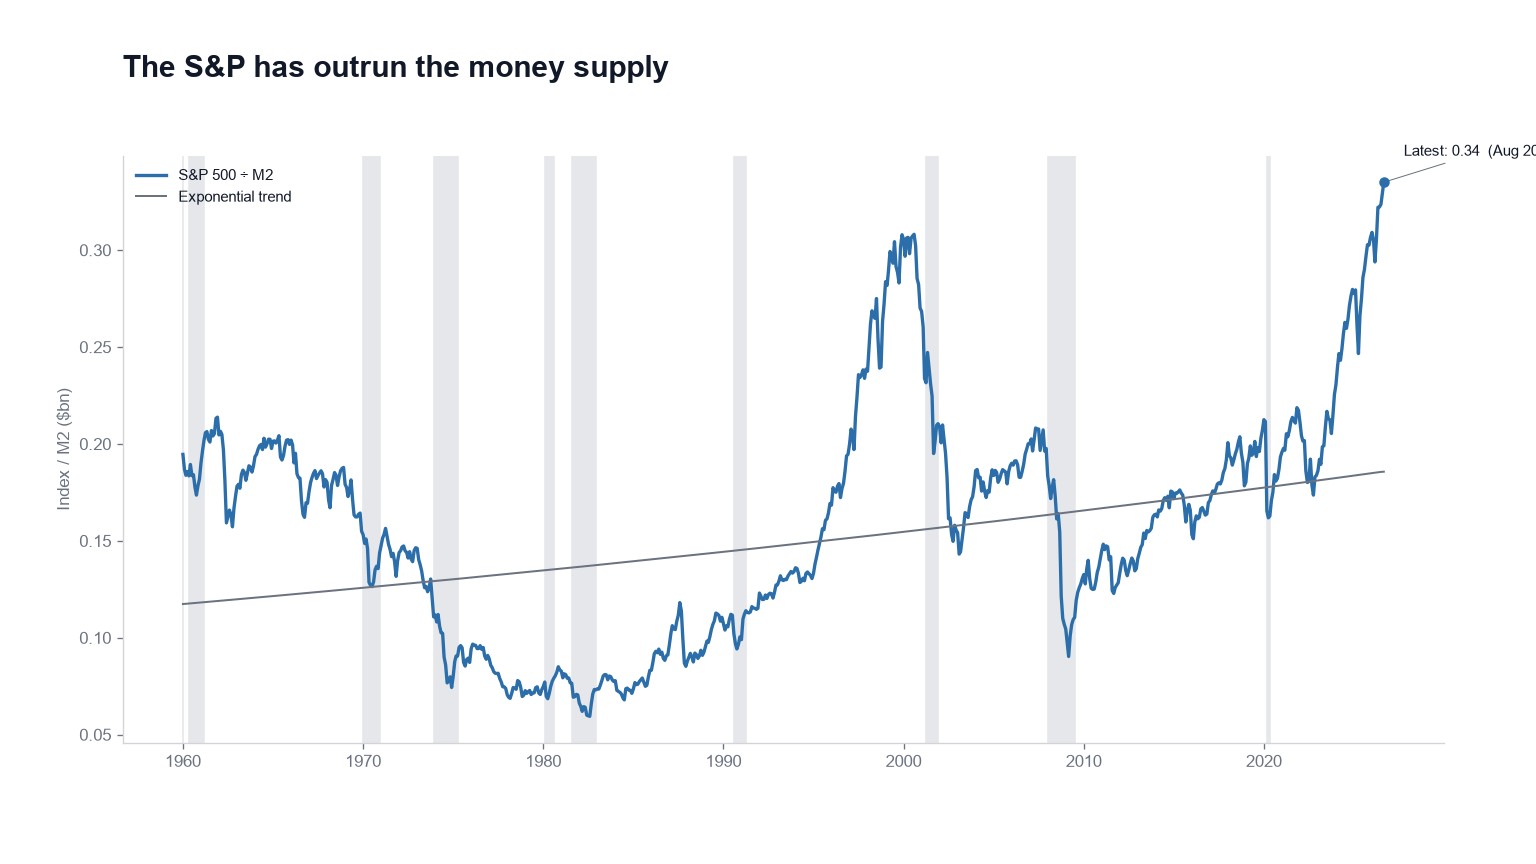
Record highs are easier when there's more money
The S&P divided by M2 is 0.335 and well above trend. Expand the money supply and nominal records take care of themselves. This ratio asks whether stocks outran the cash.
July 31, 2026
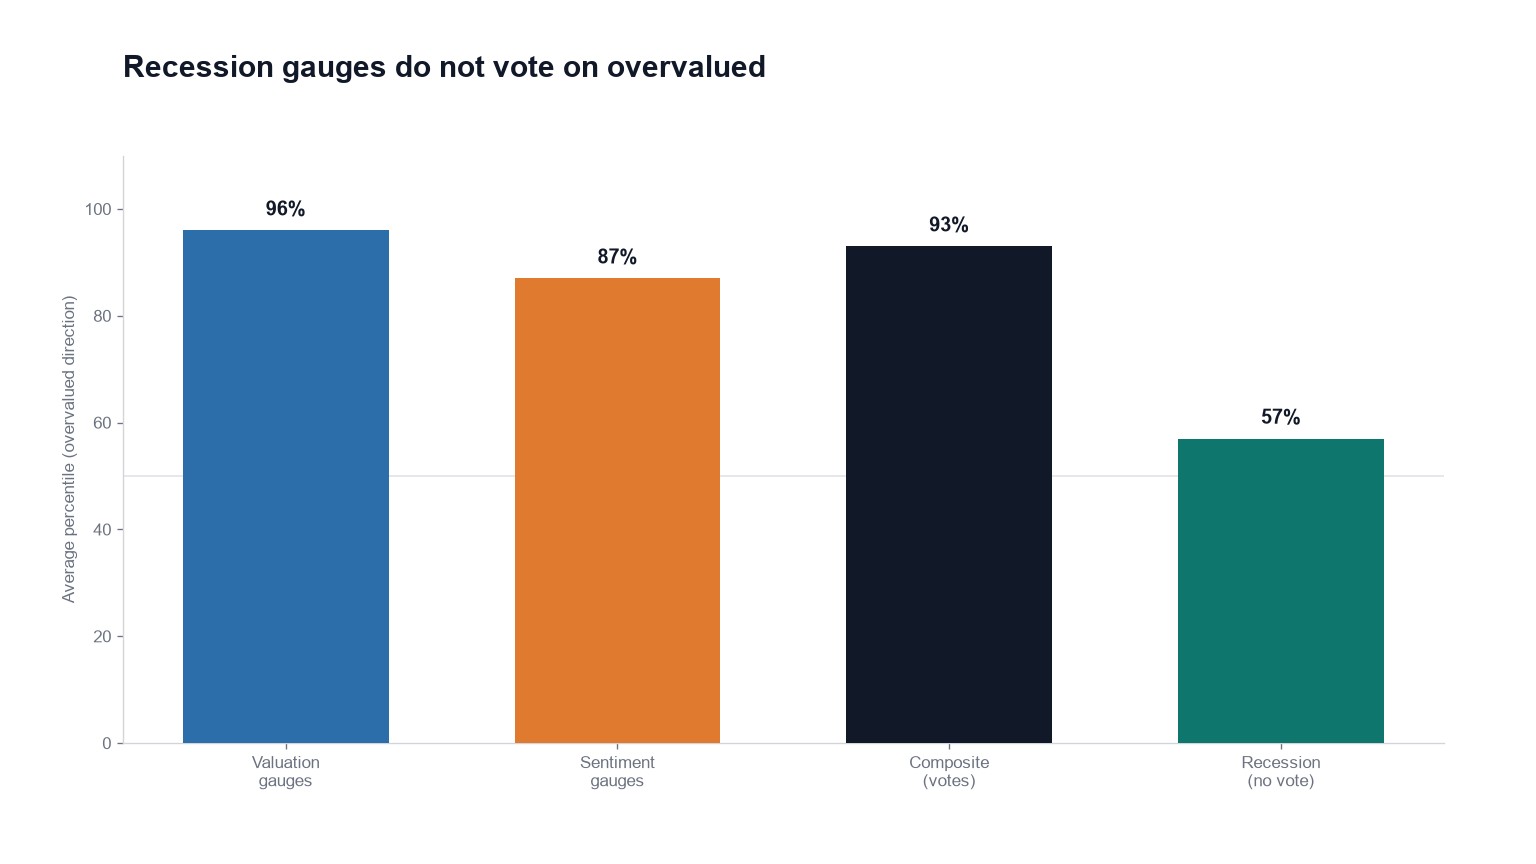
Recession gauges get a seat, not a vote
Yield curves and the Sahm Rule answer a question about the economy. We're asking a question about price. Averaging the two would ruin both answers.
July 30, 2026
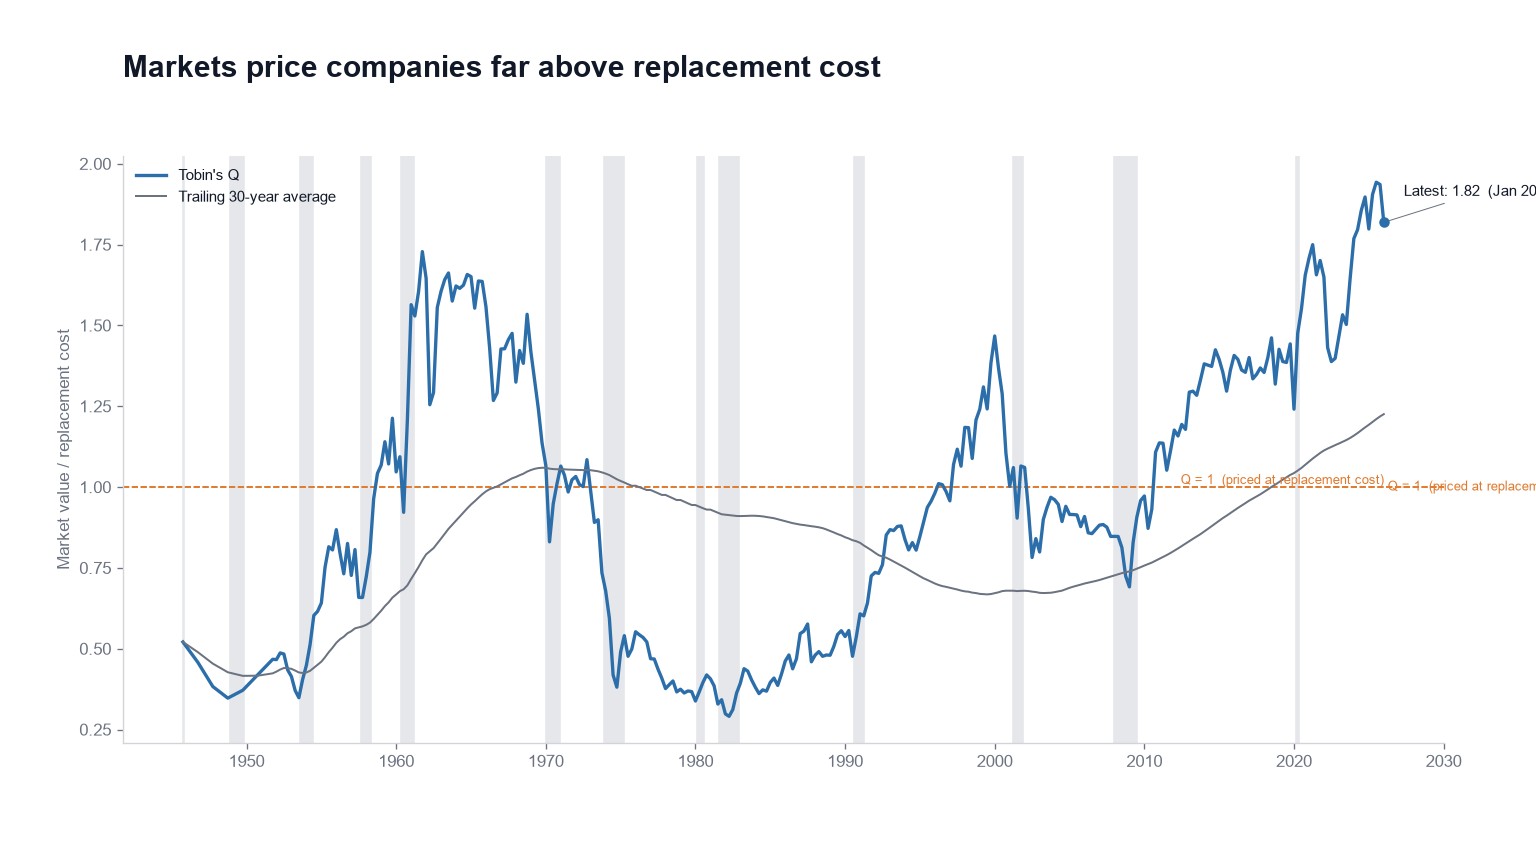
Buy the companies, or build new ones?
Tobin's Q is 1.82, so the market wants nearly twice what it would cost to rebuild these firms. Intangibles raised the baseline, and it still clears the higher one.
July 29, 2026
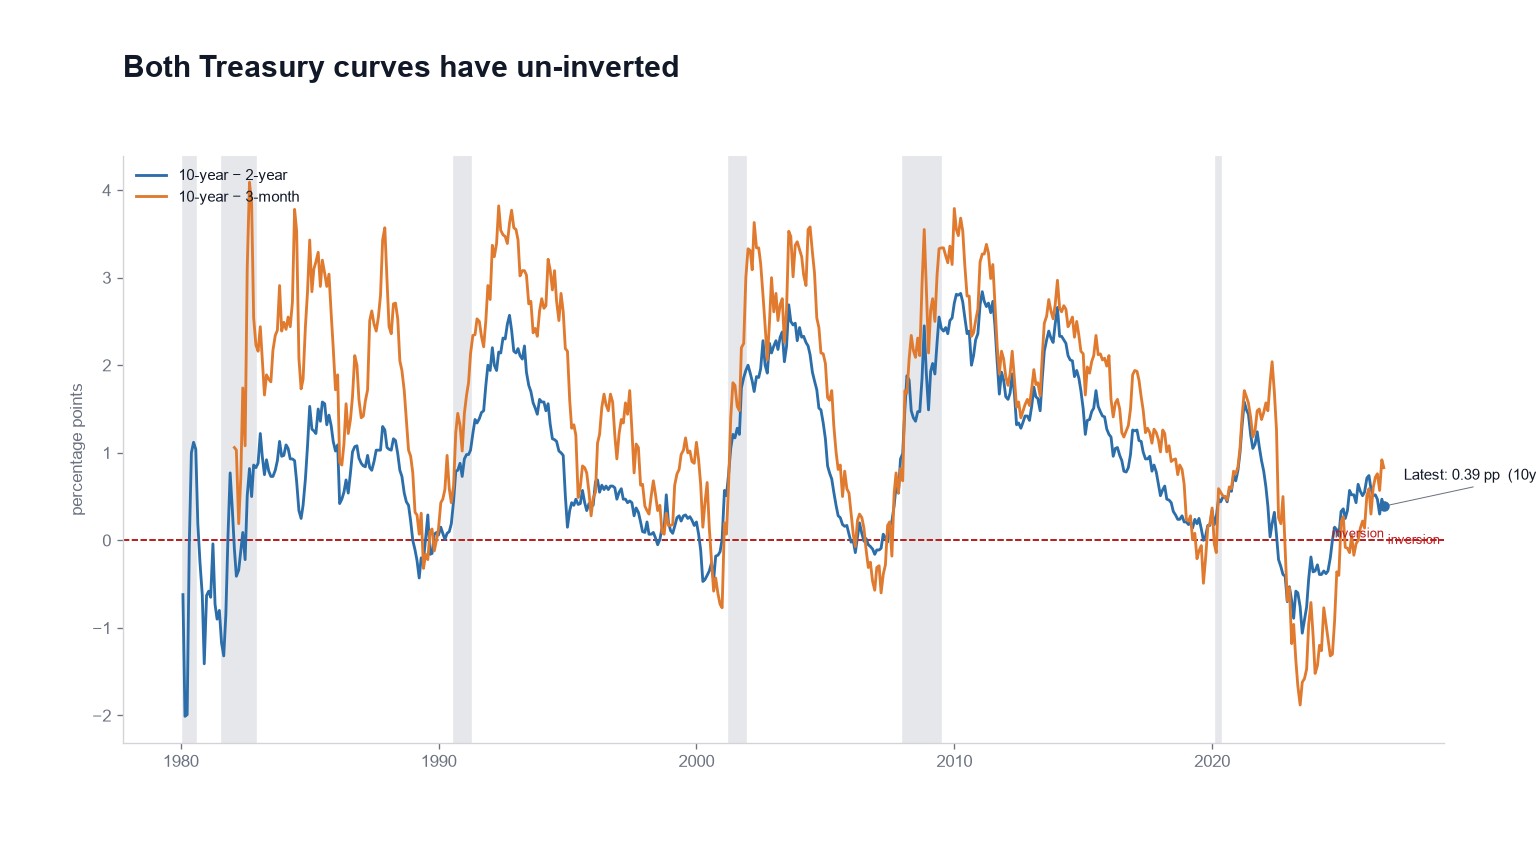
The curve went positive. Now comes the waiting.
10y–2y is +0.39 and 10y–3m is +0.83. Both positive, both graded Caution, because the damage has usually arrived after the re-steepening.
July 28, 2026
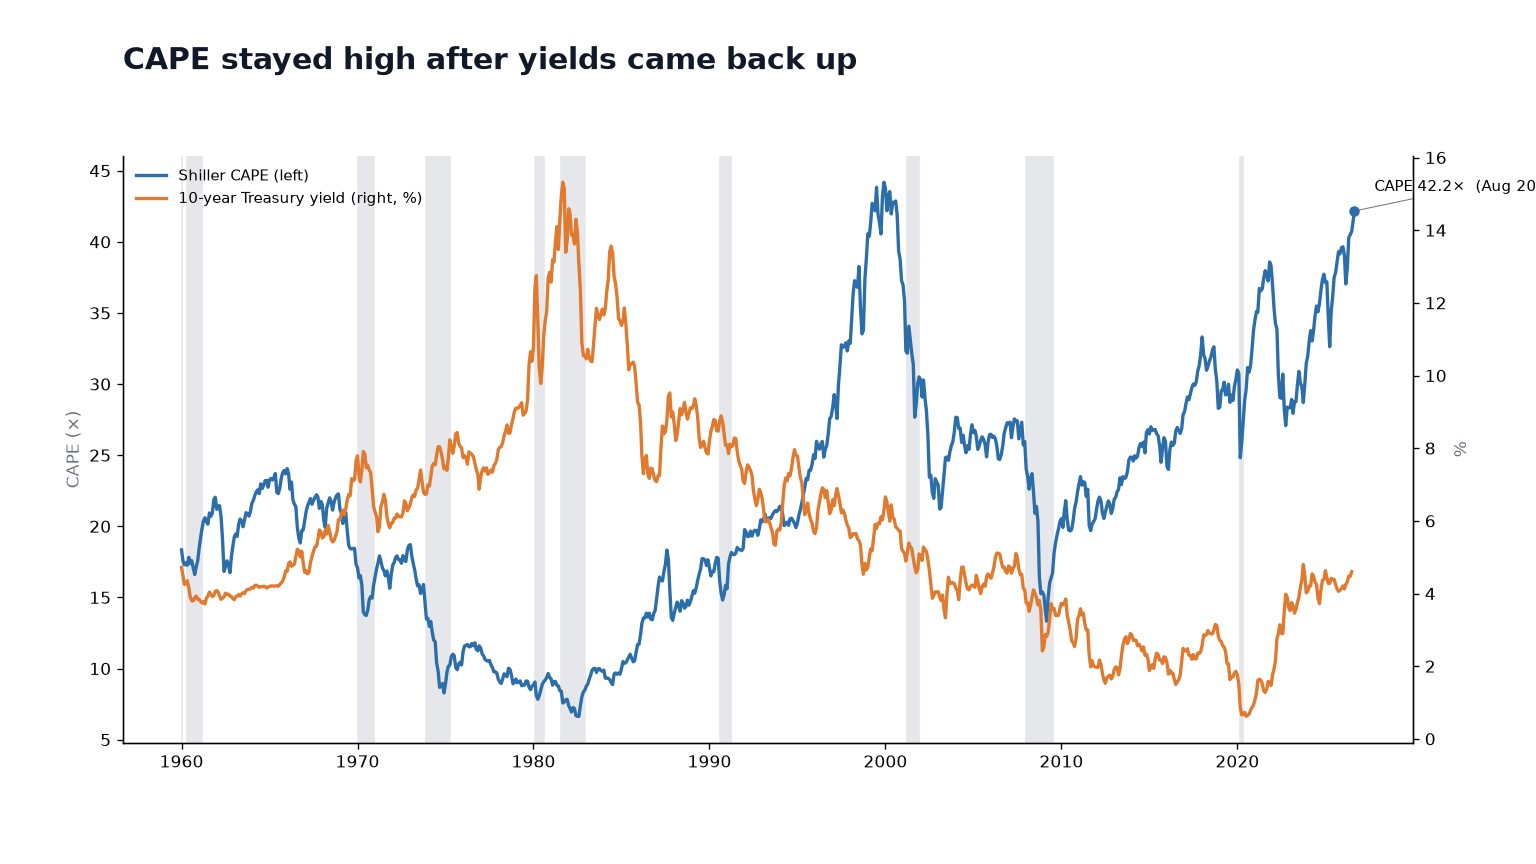
The rates argument has run out of rates
For a decade, low yields justified a high multiple. The 10-year is back near 4.6% and CAPE is still 42.17×. The interest rate model reads 4.15σ.
July 27, 2026
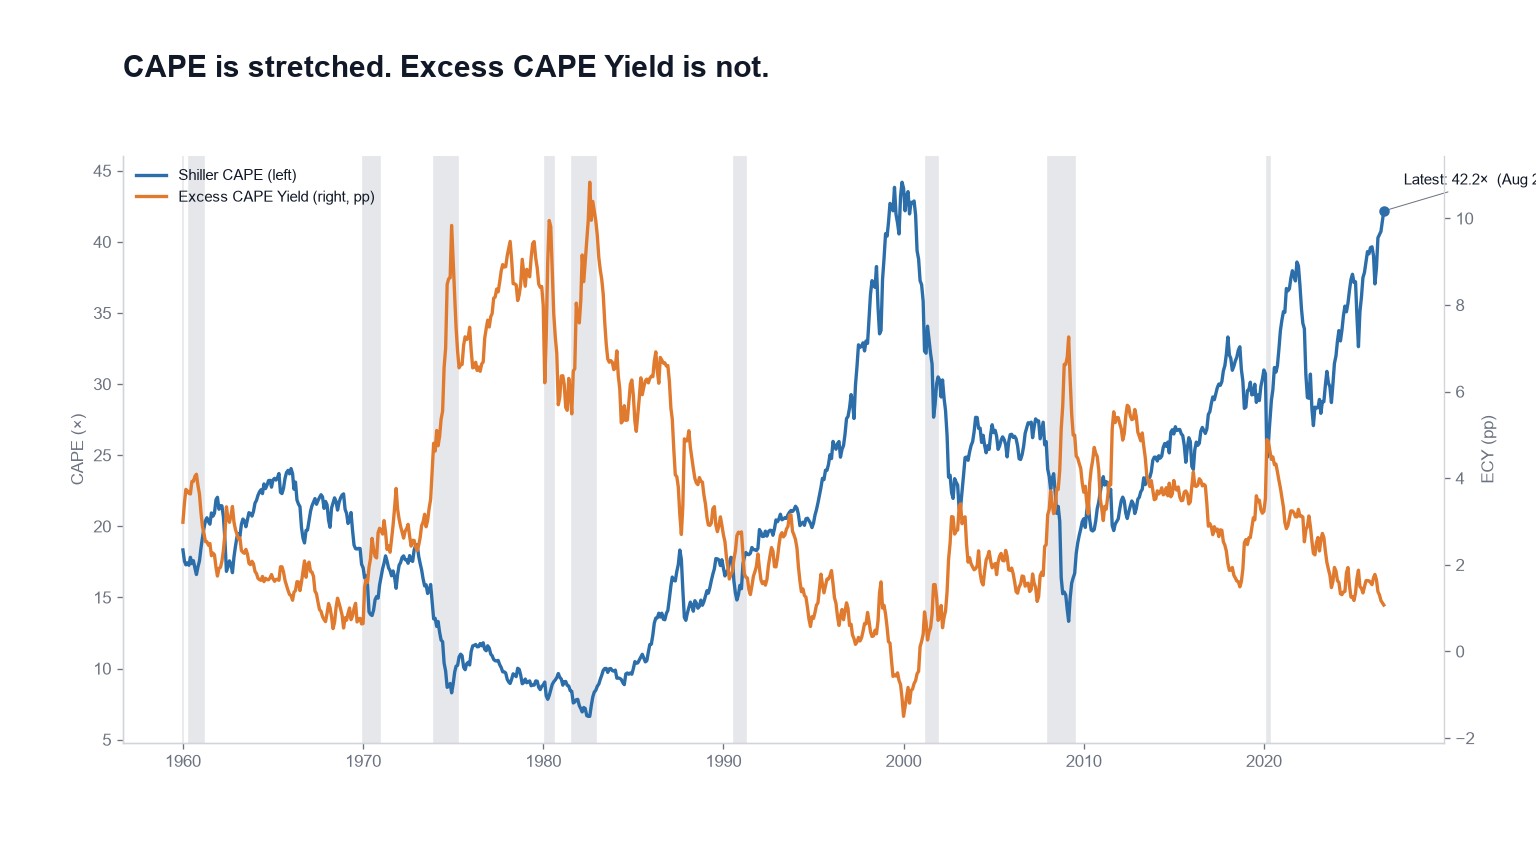
Two gauges, two answers, and rates are the difference
CAPE is 42.17× and looks like 1999. The premium stocks pay over real bonds is 1.07 points, which we grade Fair Value. They're answering different questions.
July 24, 2026
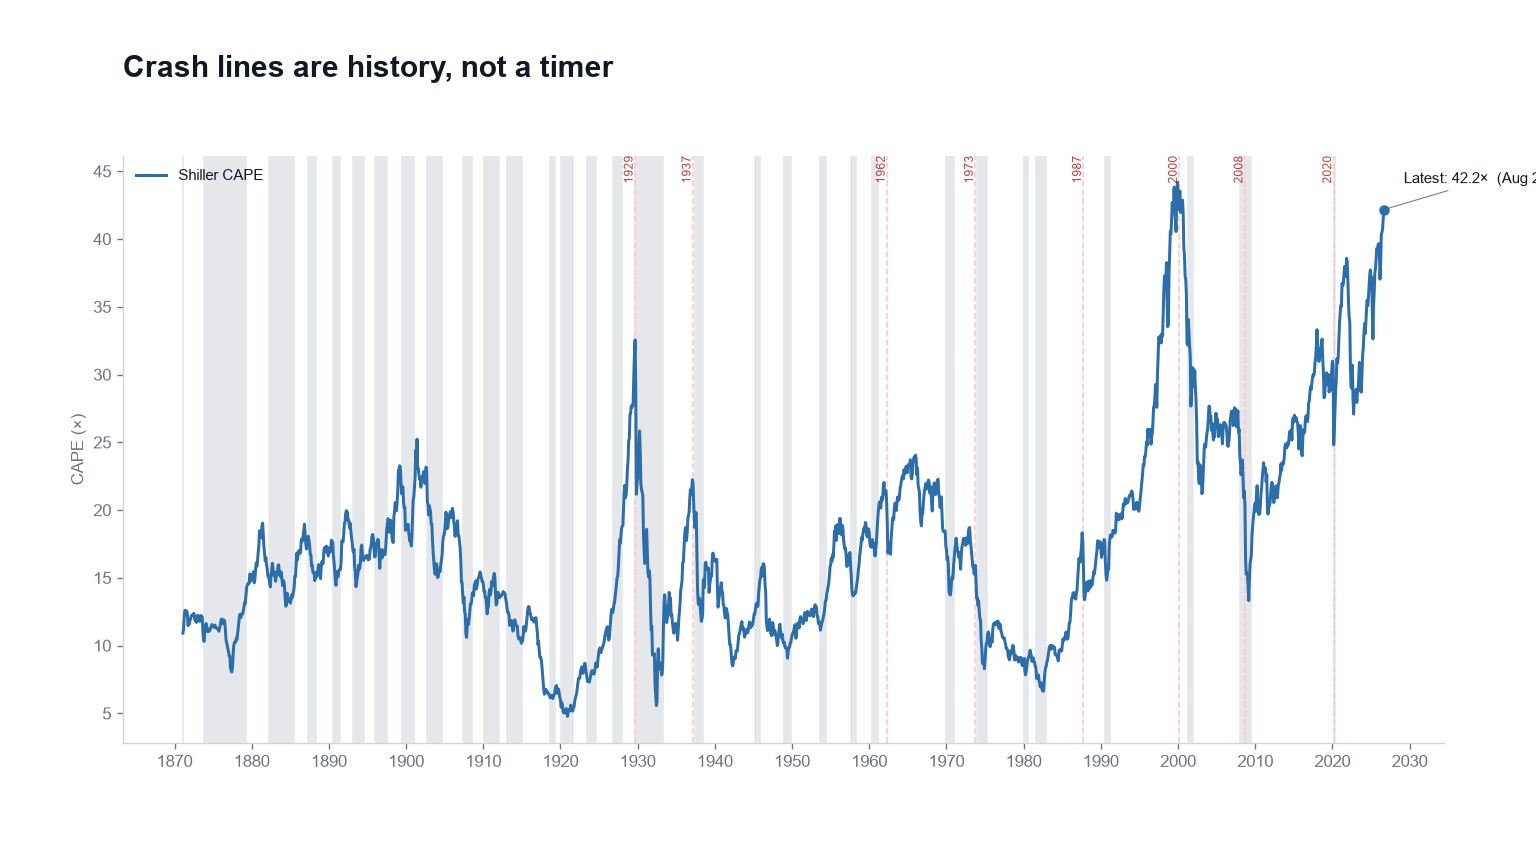
The red lines are an index of the past
We mark 1929, 1937, 1962, 1973, 1987, 2000, 2008 and 2020 so you can see what each gauge was doing when things broke. They predict nothing.
July 21, 2026
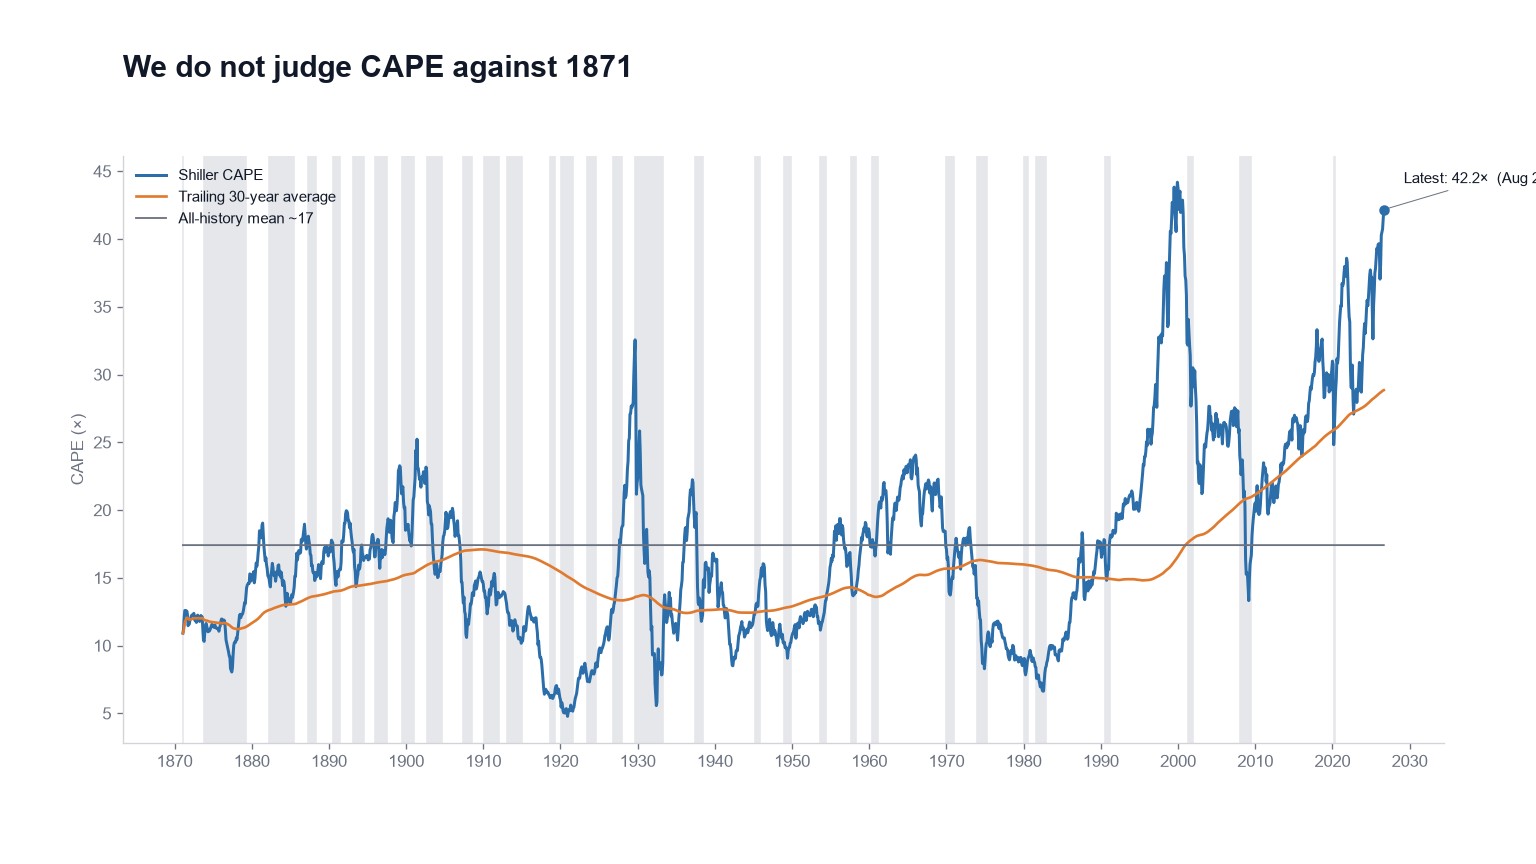
Why we don't grade this market against 1871
CAPE's all-history average is about 17. Comparing today to that treats 1871 and 2026 as the same market. We use a trailing 30-year average instead.
July 17, 2026
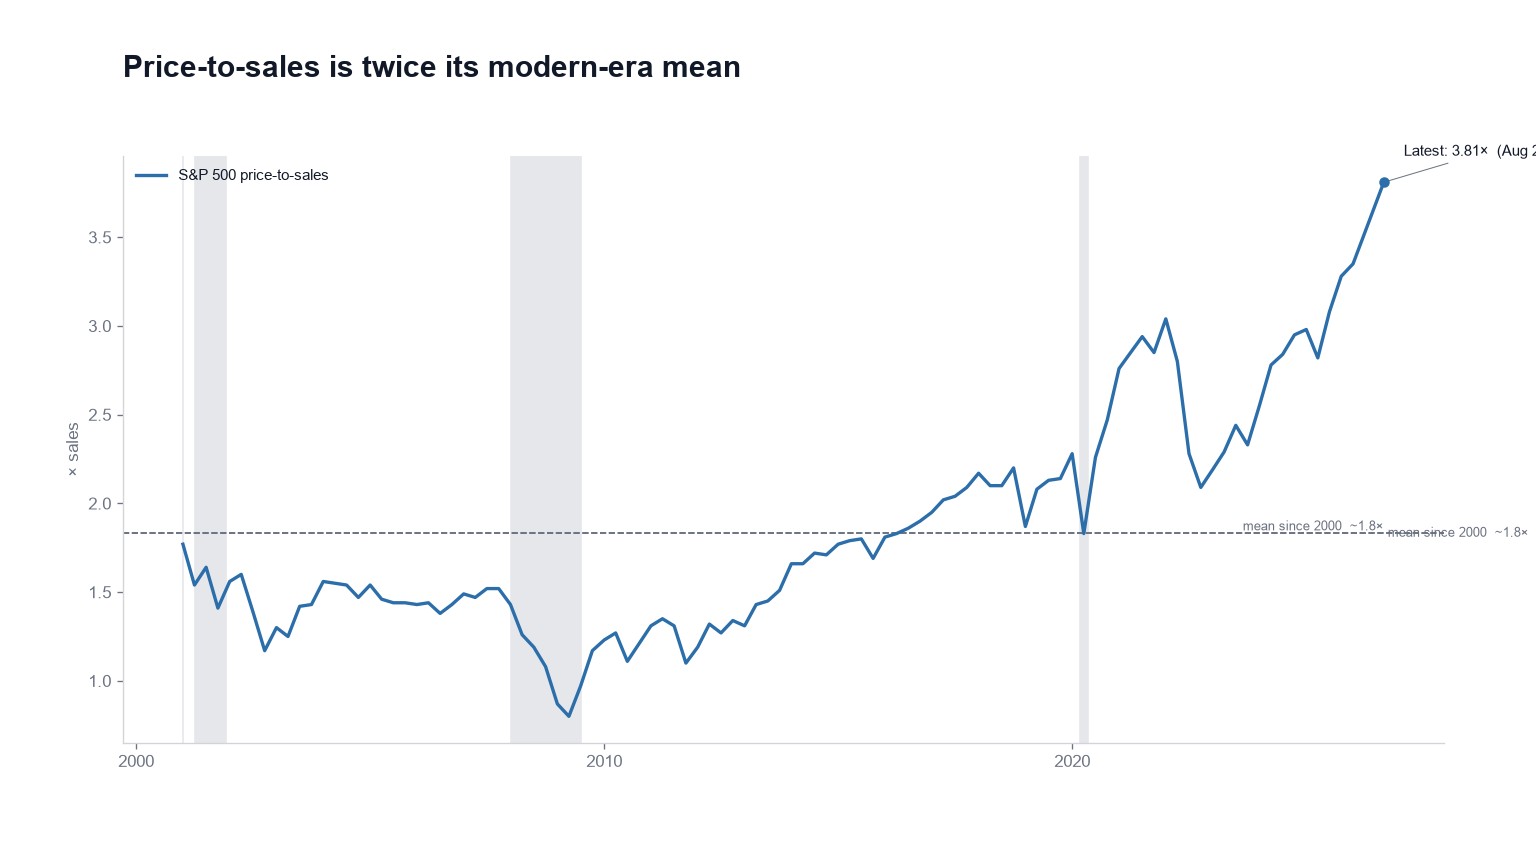
Revenue is the harder number to flatter
The S&P 500 trades at 3.81 times sales against a post-2000 average of 1.8. Buybacks and margin cycles can flatter earnings. They can't do much to the top line.
July 14, 2026