Record highs are easier when there's more money
July 31, 2026
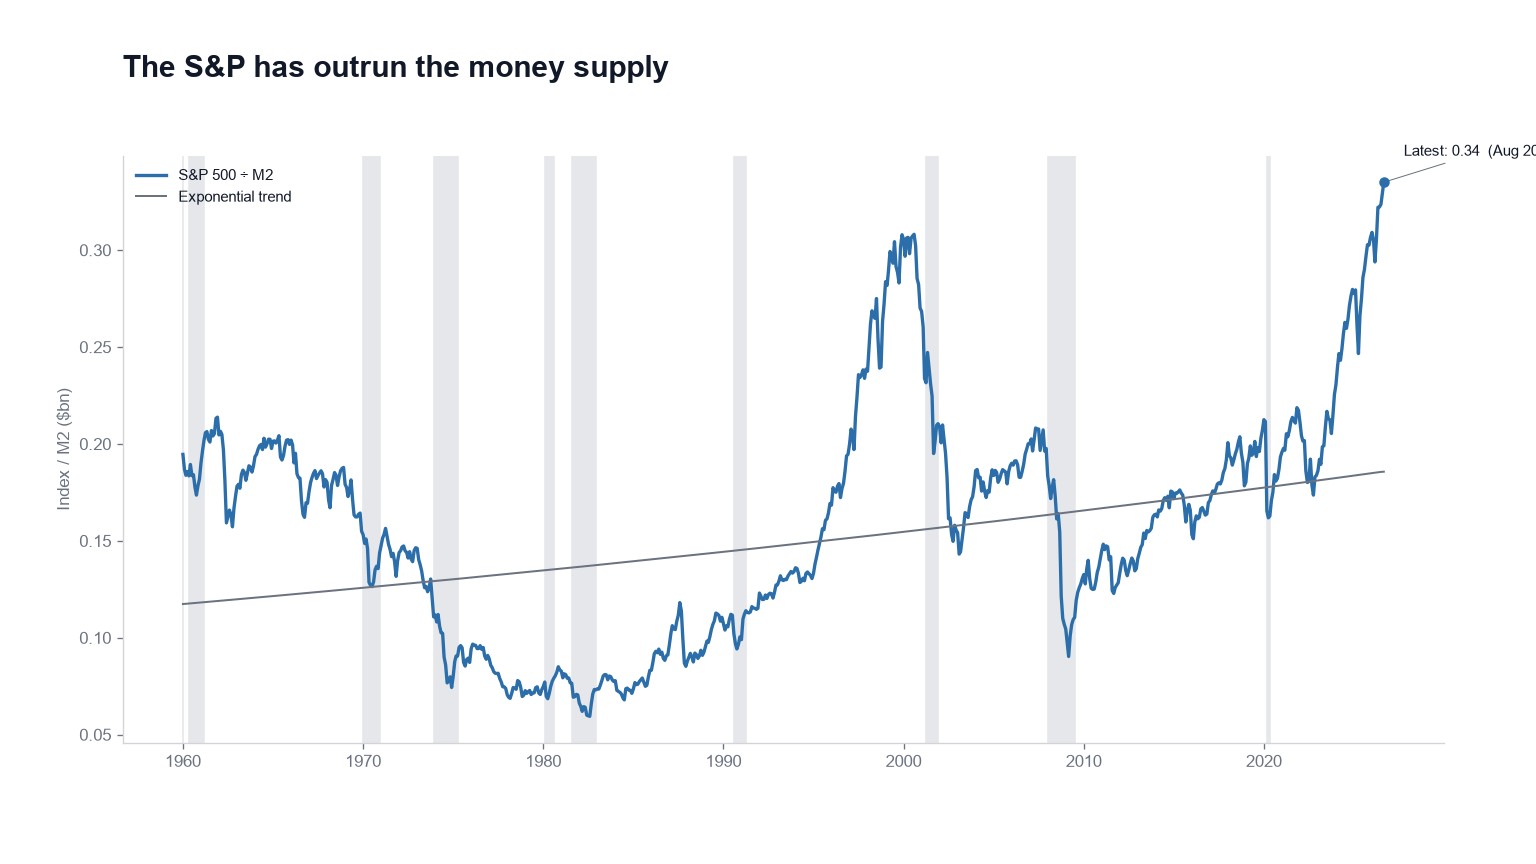
S&P 500 ÷ M2 is 0.335 as of August 28, 2026, which we grade Strongly Overvalued.
There's no textbook correct level for this ratio, and anyone offering one has misunderstood it. Both the index and the money supply grow over decades, so the only sensible test is an exponential trend. Sitting above that trend means stocks grew faster than the cash, deposits and near-money in the system.
What the ratio is for
Expand M2 and nominal record highs become much easier to print. A chart of the index in dollars starts measuring the currency as much as the companies.
Dividing by the money stock is a crude deflator that routes around both CPI and earnings. It asks one question: are equities gaining on the quantity of money, or floating upward with it? Readings below trend have marked the cheaper markets of the past, and today's print registers as a 99th-percentile stretch on the overvaluation probability page.
One warning about the data itself. M2's official definition changed in 2020, which left a visible seam in the series and means the pre-2020 and post-2020 stretches aren't strictly comparable. Read it as a trend rather than treating any level as authoritative, and read it beside gauges that never heard of the money supply: CAPE, price-to-sales, the Buffett Indicator.
Liquidity explains the move, not the level
There's a familiar argument that all this money has to go somewhere, and where it goes is equities. Sometimes that's true, and it accounts for a good deal of what happened after 2020.
But look at what it means for the ratio to sit above trend. If stocks were simply absorbing the new money, the line would track the trend: money up, stocks up, ratio flat. That's what the argument predicts.
The line isn't flat. It sits well above trend, which says prices outran the very thing that was supposed to explain them, and that's the reading we carry on the homepage. Liquidity can account for part of the journey without justifying where it ended up.