Buy the companies, or build new ones?
July 29, 2026
James Tobin asked a question worth borrowing: would it be cheaper to buy the companies that already exist, or to build new ones from scratch?
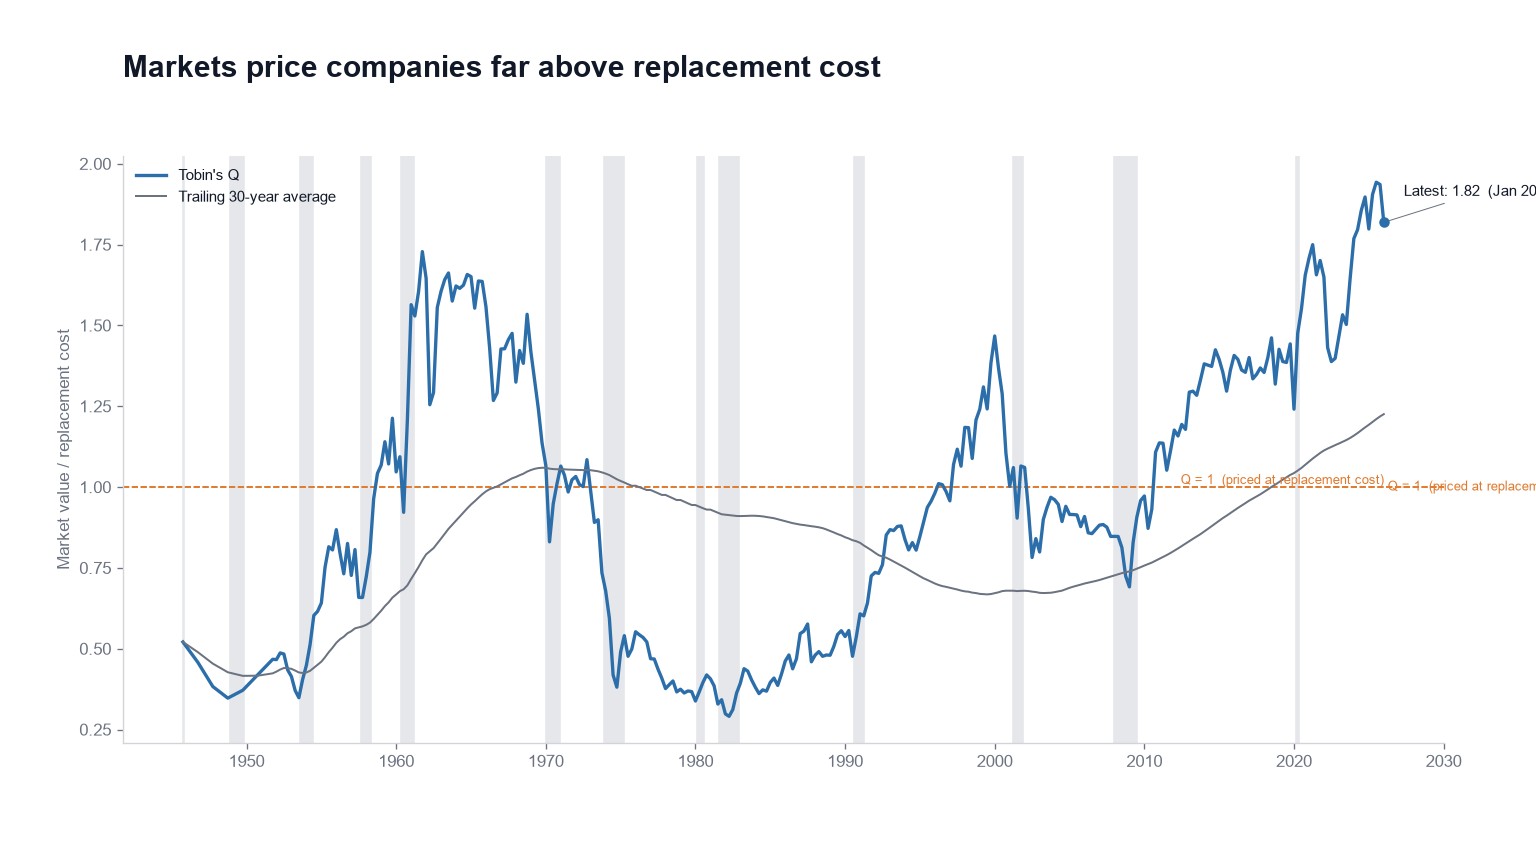
His ratio answers it. The market value of nonfinancial corporate equities goes on top, and the replacement cost of those firms goes on the bottom, measured as their net worth in the same Federal Reserve Z.1 accounts that feed the Buffett Indicator. A Q of 1.0 means investors are paying exactly what the assets would cost to recreate.
Tobin's Q is 1.82, which we grade Overvalued. The all-history mean is around 0.75, and we don't use it for the verdict.
Replacement cost got harder to measure
Try putting a brand on a balance sheet at replacement cost. Or a network effect, or the fact that most of the market already knows how to use your software. It can't be done properly, which means Q understates the real asset base of a modern index.
That criticism is legitimate and we're not going to argue with it. It's also why Q's 30-year average has drifted up: an economy of asset-light firms should print a structurally higher typical Q than an economy of steel mills, and the benchmark has to move with that.
Even against the raised benchmark, 1.82 sits a long way above 1.0. The 2000 peak reached about 1.6, 2021 set a fresh extreme, and we're back in that territory now.
One more limit worth stating. The series is quarterly and it lags, so the latest stamp isn't last week's market. Treat it as a slow-moving ratio of wealth to physical stuff rather than something to check often.
Three denominators, one answer
Buffett divides by what the country produces. Q divides by what the assets would cost to replace. Price-to-sales divides by what customers paid.
When one of the three looks rich, arguing about the denominator is reasonable, and we've made those arguments ourselves. When all three look rich at once, the denominator stops being a plausible explanation.
The live figure is on the homepage. A Q above 1 means the market is asking more for these companies than it would notionally cost a competitor to build rivals and compete them into the ground. Staying above 1 for years is the whole of the overvaluation claim.