Recession gauges get a seat, not a vote
July 30, 2026
This site asks one question: are US stock prices high compared to their own history? That's a question about valuation and positioning, and everything that votes on the overvaluation probability is there because it helps answer it.
The 10-year minus 2-year curve, the 10-year minus 3-month curve and the Sahm Rule answer a different question. They measure how much stress is showing up in rates and in jobs. It's a good question and we display all three on the homepage, but none of them enters the composite.
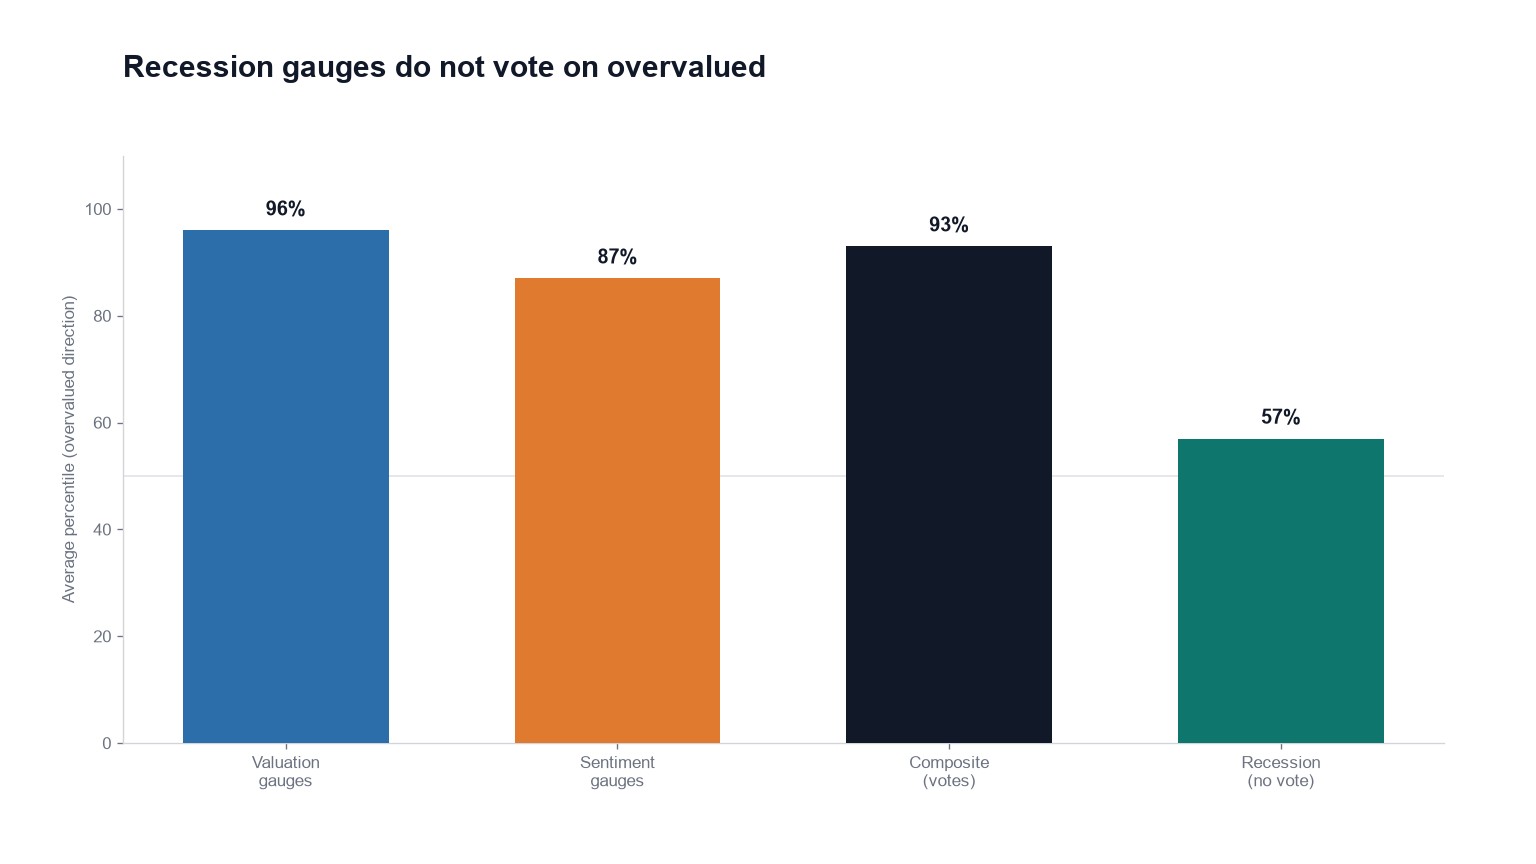
What averaging them together would produce
As of August 28, 2026 the ten valuation and sentiment gauges average 93%. Valuation on its own is 96% and sentiment is 87%. The three recession gauges average 57%, and that 57% appears nowhere in the 93%.
Picture the alternative. A quiet Sahm Rule at the 31st percentile would pull down a Buffett Indicator sitting at the 100th. An un-inverted curve would partly cancel a 42× CAPE. The resulting number would move when either the economy or the market moved, and a reader would have no way to tell which had happened.
That's the cost of a single headline score: it only means something if every input answers the same question. We'd rather run two clean measurements than one blended one, and the blend is the version we're rejecting on purpose.
The objection we get most
The curve un-inverted. Unemployment hasn't broken. Both are true, and neither is an argument about valuation.
Stocks can be expensive through an entire expansion, and they can stay expensive going into a recession. Cheap markets have coexisted with healthy economies, and so have wildly expensive ones. If a good jobs number could make a market cheap, the two series would be measuring the same thing, and they demonstrably aren't.
What the recession row is for
Context, which is worth the space on the page even without a vote.
Both curves have un-inverted and both read Caution rather than all-clear, because historically the damage has tended to arrive after the re-steepening rather than at the inversion low. Sahm sits at 0 against a 0.50 trigger, so the labor market hasn't confirmed anything yet.
All of that is useful. None of it makes 214% of GDP a normal market capitalisation.