Is the Stock Market Overvalued?
YES
As of , 8 of 10 valuation and sentiment indicators signal the US stock market is overvalued — a composite overvaluation probability of 92%.
Readings like today’s have historically been followed by the weakest decade-ahead real returns on record. That is a statement about the long run, not a crash prediction — see what happened after past readings like today’s.
Overvaluation probability
Composite of all 10 indicators vs. their history.
Shiller CAPE ratio
Price divided by 10-year average, inflation-adjusted earnings.
Excess CAPE Yield
Stock earnings yield minus the real bond yield.
Buffett Indicator
Total US stock market value as a percentage of GDP.
Tobin's Q
Market value of companies vs. their replacement cost.
S&P 500 ÷ M2
The S&P 500 measured against the money supply.
S&P 500 price-to-sales
What investors pay for each dollar of S&P 500 sales.
Interest rate model
S&P 500 position given the 10-year Treasury yield.
VIX
The market's 'fear index' of expected volatility.
High-yield credit spread
Extra yield investors demand to hold junk bonds.
Household equity allocation
Share of household financial assets held in stocks.
Yield curve (10y–2y)
The gap between 10-year and 2-year Treasury yields.
Yield curve (10y–3m)
The classic 10-year vs 3-month Treasury spread.
Sahm Rule
How far unemployment has risen from its recent low.
Articles
All articles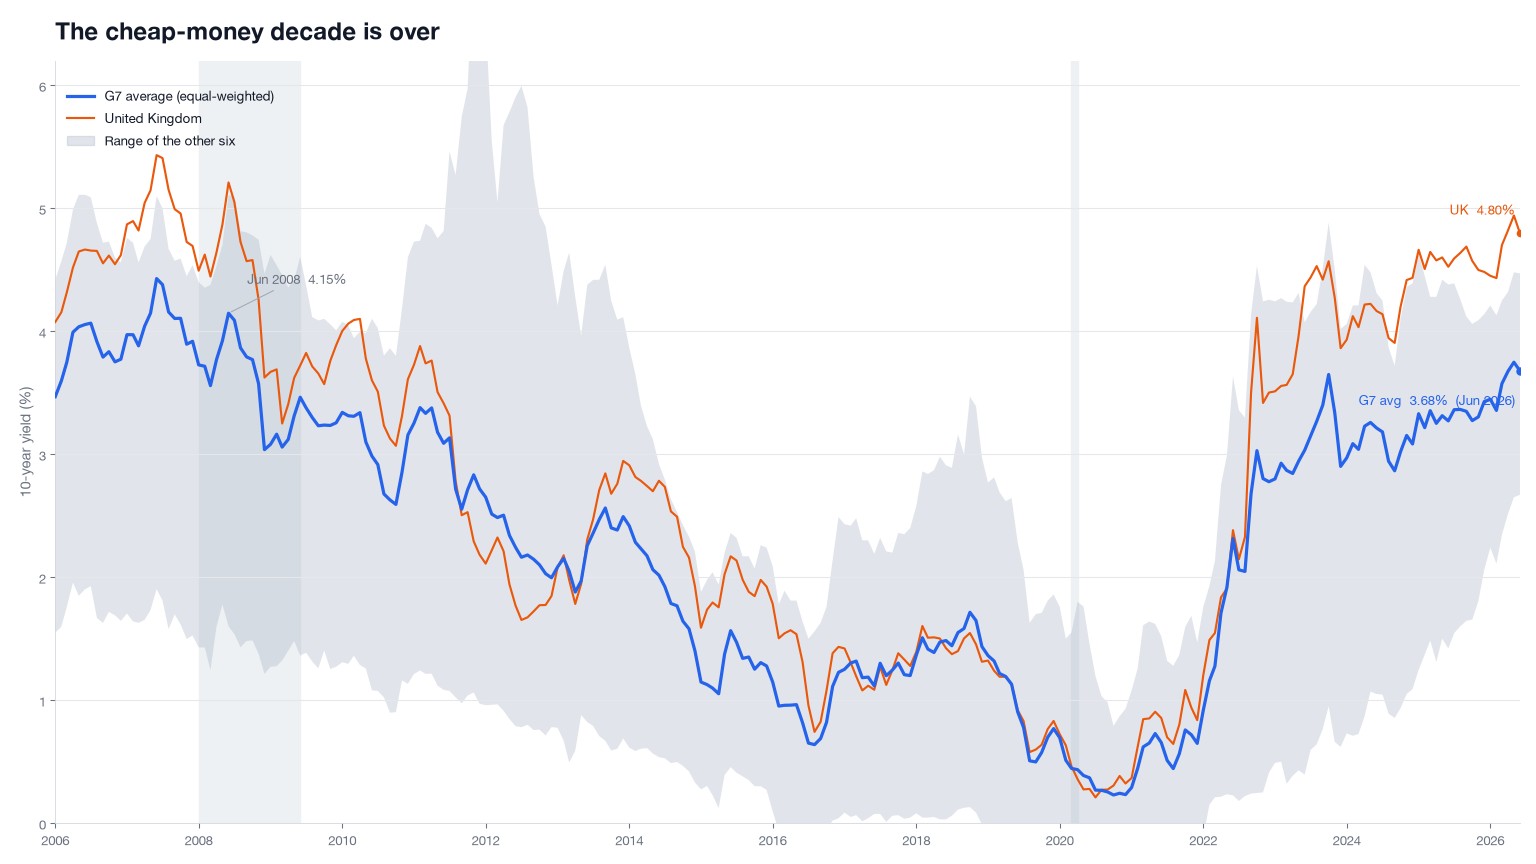
The G7 is paying 2008 rates. Stocks are not.
The seven G7 10-year yields average 4.08% today, last seen in the summer of 2008. The multiple is still priced for the decade after that.
September 15, 2026
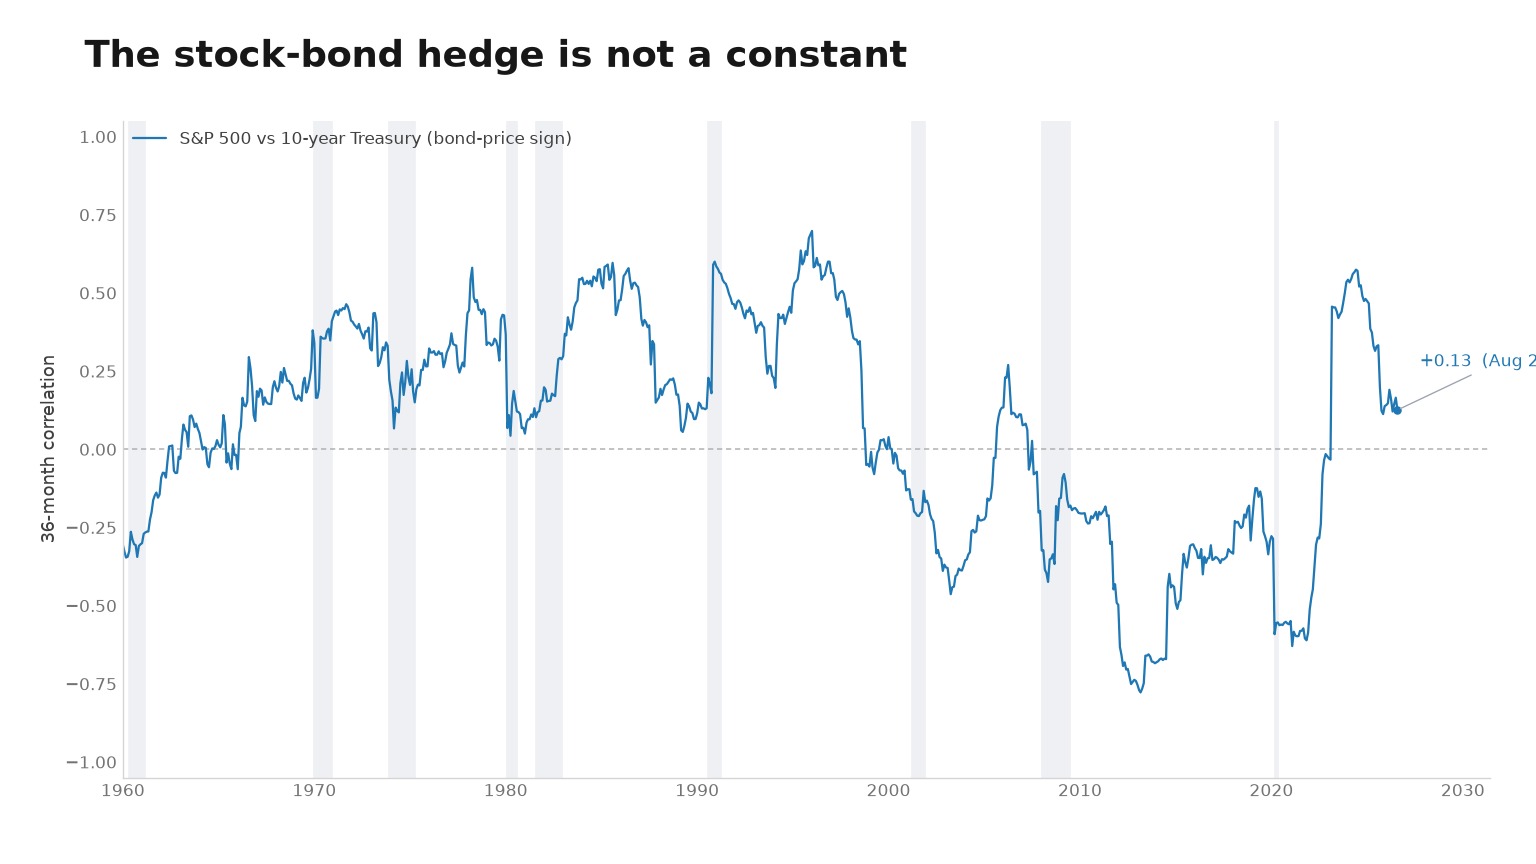
The same rate move is not the same signal
Wang splits stock returns into a Treasury-like duration piece and a payoff piece. Rates that fall in a recession cushion stocks. Rates that rise on growth news take some of the gain back. One yield is not one input.
September 10, 2026
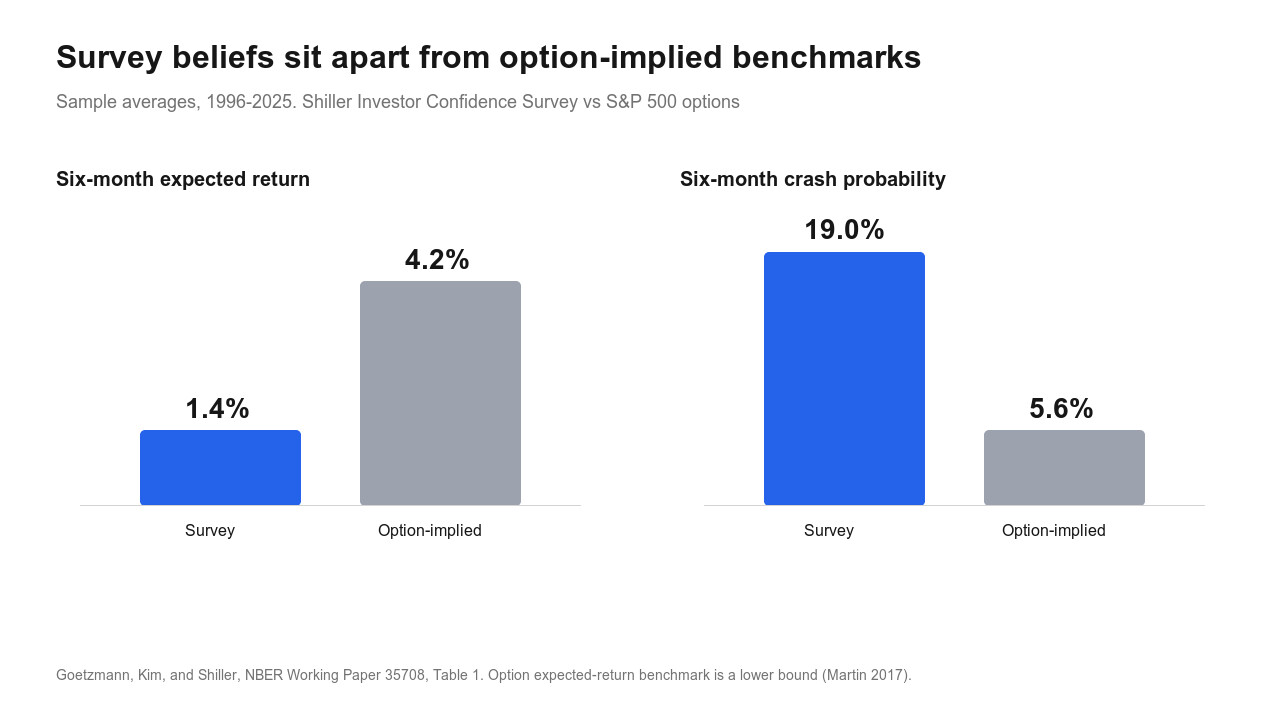
The survey is not the market
Survey averages mix people who left with people who set prices. The useful number is the gap versus options.
September 9, 2026
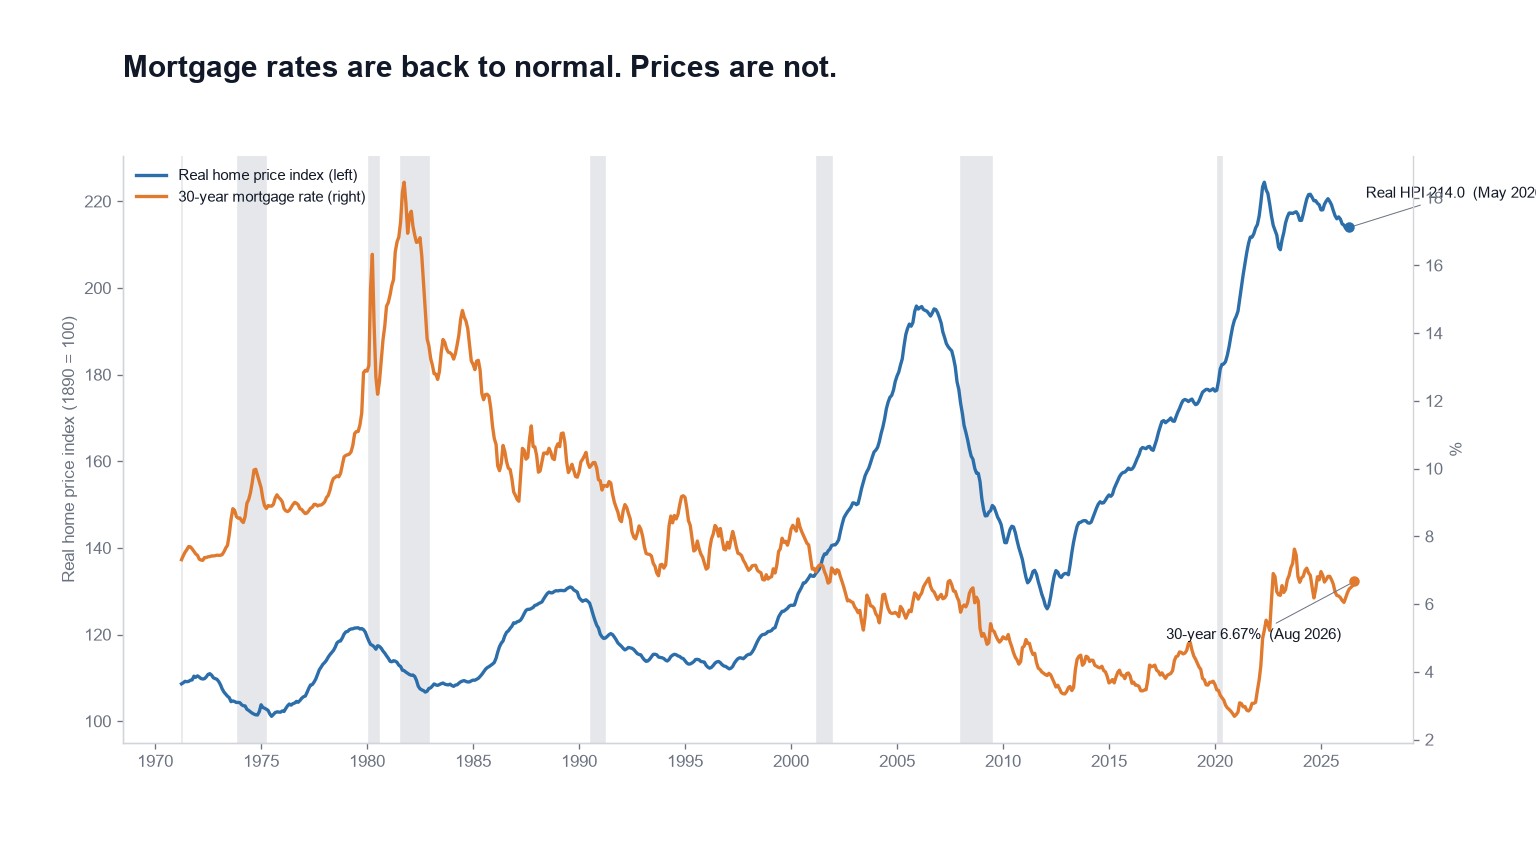
Mortgage rates are back to normal. Prices are not.
The 30-year mortgage is 6.66%, below its own 7.68% average. Real home prices are still 27.9% above a trailing 30-year mean.
September 1, 2026
What "overvalued" means and how we measure it
The US stock market is “overvalued” when prices sit far above what the underlying fundamentals — earnings, economic output, replacement cost, interest rates, and the money supply — have historically supported. No single number proves a market is a bubble, so this page tracks thirteen gauges: valuation and sentiment measures that each flagged danger before past crashes — including an interest rate model of S&P 500 position versus the 10-year Treasury and household equity allocation — plus recession indicators for cycle context — and shows them live so you can judge for yourself.
The headline YES/MAYBE is a majority vote of the valuation and sentiment gauges only (recession gauges do not vote). Each of those is compared against its own trend — a trailing 30-year average for long-history gauges whose “normal” has shifted over time, an exponential regression for structurally growing ratios, or a flat historical mean — and expressed as a z-score, the number of standard deviations from that trend. Readings more than one standard deviation into expensive territory count as “Overvalued,” and more than two as “Strongly Overvalued.” Gauges where a low reading is the dangerous one — the Excess CAPE Yield and the VIX — are inverted.
The thirteen gauges
- Shiller CAPE ratio — Price divided by 10-year average, inflation-adjusted earnings.
- Excess CAPE Yield — Stock earnings yield minus the real bond yield.
- Buffett Indicator — Total US stock market value as a percentage of GDP.
- Tobin's Q — Market value of companies vs. their replacement cost.
- S&P 500 ÷ M2 — The S&P 500 measured against the money supply.
- S&P 500 price-to-sales — What investors pay for each dollar of S&P 500 sales.
- Interest rate model — S&P 500 position given the 10-year Treasury yield.
- VIX — The market's 'fear index' of expected volatility.
- High-yield credit spread — Extra yield investors demand to hold junk bonds.
- Household equity allocation — Share of household financial assets held in stocks.
- Yield curve (10y–2y) — The gap between 10-year and 2-year Treasury yields.
- Yield curve (10y–3m) — The classic 10-year vs 3-month Treasury spread.
- Sahm Rule — How far unemployment has risen from its recent low.
Related composite
- Overvaluation probability — equal-weighted blend of the ten headline valuation and sentiment gauges.
Data and updates
The readings are rebuilt automatically every US market weekday, about an hour before the opening bell, from public data: the Federal Reserve Economic Data service (FRED) and Robert Shiller’s dataset via multpl.com. This is not financial advice — valuation indicators describe long-run conditions, not short-term timing.
Frequently asked questions
More definitions — including every statistical term above — are on the full FAQ page.
- Is the US stock market overvalued right now?
- The headline YES/MAYBE is a majority vote of the ten valuation and sentiment gauges — Shiller CAPE, Excess CAPE Yield, Buffett Indicator, Tobin’s Q, S&P 500 ÷ M2, price-to-sales, the interest rate model, VIX, the high-yield credit spread, and household equity allocation. Recession indicators (yield curves and the Sahm Rule) stay on the page for cycle context but do not vote on whether prices are rich.
- What indicators show whether the stock market is overvalued?
- Thirteen gauges in total: seven valuation (Shiller CAPE, Excess CAPE Yield, Buffett Indicator, Tobin’s Q, S&P 500 ÷ M2, price-to-sales, and the interest rate model), three sentiment (VIX, high-yield credit spread, household equity allocation), and three recession (10y–2y and 10y–3m yield curves, Sahm Rule). Ten of those — all seven valuation gauges plus the three sentiment gauges — feed the headline YES/MAYBE and composite probability. Recession gauges are shown for cycle context but do not vote.
- How is the overvalued verdict calculated?
- Each valuation and sentiment indicator is compared against its own trend — a trailing 30-year average, an exponential regression, a flat historical mean, or (for the interest rate model) its own σ-unit composite — and expressed as a z-score. Readings above +1σ count as overvalued; above +2σ as strongly overvalued. Gauges where a low value is the dangerous one (Excess CAPE Yield, VIX) are inverted. If a majority of those ten read overvalued, the headline is YES; otherwise MAYBE. Recession gauges are excluded from that vote.
- Do these indicators account for interest rates?
- Yes. The Excess CAPE Yield measures the premium stocks offer over the real 10-year Treasury yield, and the interest rate model measures S&P 500 position conditioned on the 10-year yield. Both are valuation gauges that vote on the homepage YES/MAYBE and the overvaluation probability.
- How is the overvaluation probability calculated?
- For each of the ten valuation and sentiment indicators we take its direction-adjusted z-score, pass it through the normal distribution to get a percentile, and average those percentiles with equal weight. Recession gauges are left out of that average. 50% means the headline gauges sit near their historical norms; 100% would mean every one of them is at a historic extreme.
- How often is this updated?
- Every US market weekday, about an hour before the opening bell. The indicators are rebuilt automatically from public data, so the readings and the verdict stay current.
- Is this financial advice?
- No. High readings have historically meant below-average returns over the following decade, not an imminent decline — markets can stay expensive for years. Nothing here is financial advice or a recommendation to buy or sell any security. Draw your own conclusions.