Revenue is the harder number to flatter
July 14, 2026
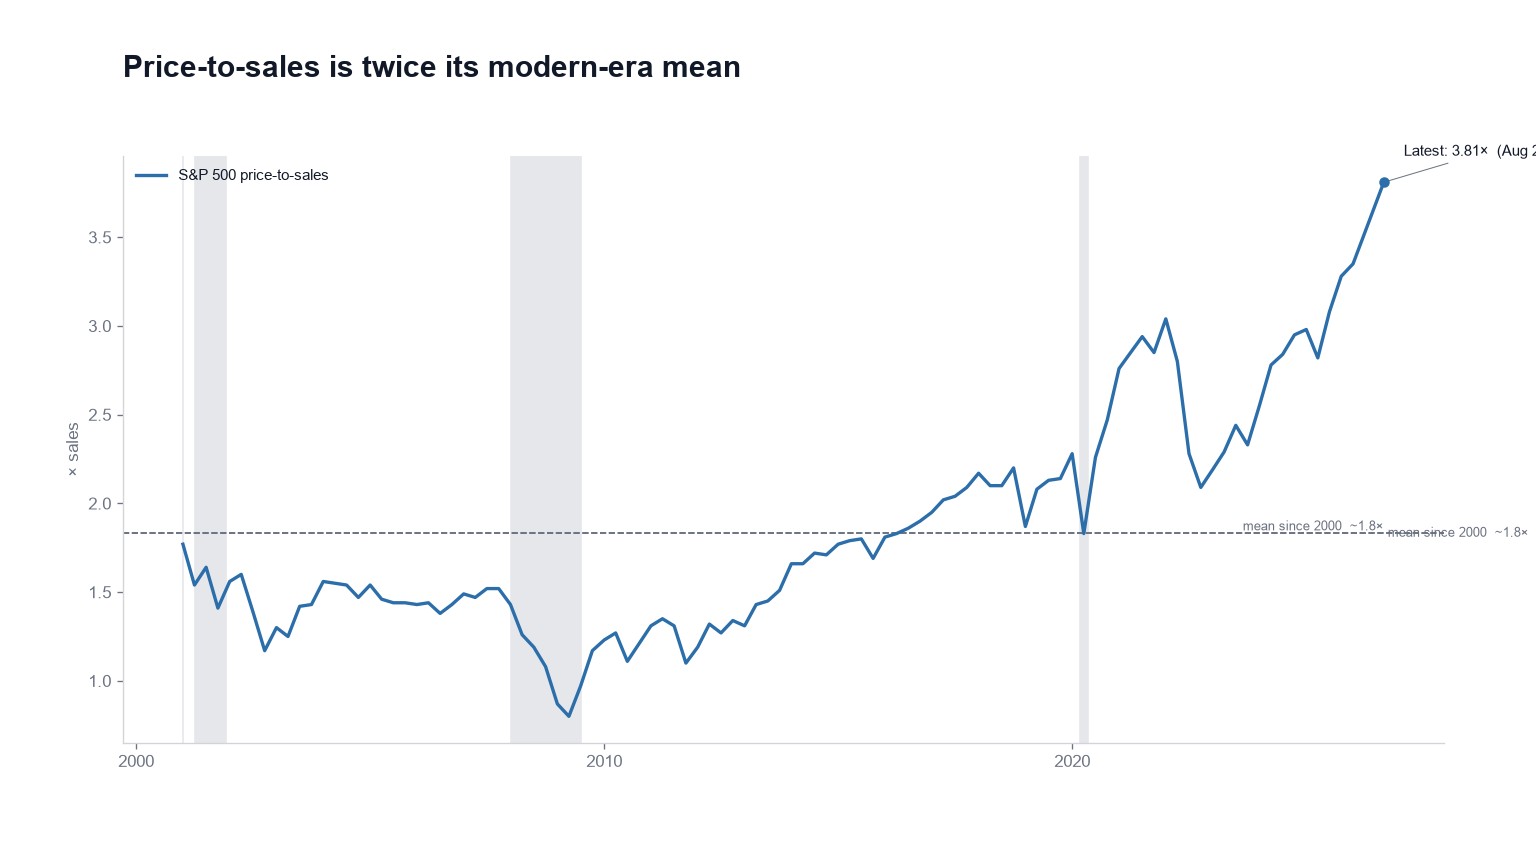
S&P 500 price-to-sales reached 3.81× on August 28, 2026, against an average near 1.8 since 2000. We grade it Overvalued.
The reason to track sales when we already track earnings is that earnings have more moving parts. Buybacks shrink the share count, low interest expense pads the bottom line, and margins can run hot for a full cycle before anyone concedes it was a cycle. Revenue does none of that. Revenue is what customers actually paid.
The blunter question
CAPE already smooths earnings across ten years, which handles an ordinary business cycle well. What it can't handle is a decade that was unusually profitable from beginning to end, because then the ten-year average is itself elevated.
Price-to-sales asks something cruder and harder to argue with: what are you paying for a dollar of revenue? After 2008 the answer was 1 to 1.5×. Anything near 3× and above is a large premium for that same dollar.
Two caveats belong here, and both are on the methodology page. The series is short, so we grade against a flat modern-era mean rather than a century average. And the index holds far more high-margin technology than it used to, which lifts the aggregate ratio even if no individual company rerated at all. Some of the uptrend is composition rather than enthusiasm.
Grant both in full and 3.81× is still more than double 1.8.
Where it disagrees with the P/E
The margin argument runs in the opposite direction from how it usually gets deployed.
If today's profits are depressed, then a high P/E overstates how expensive stocks are, and the multiple should come down as earnings recover. That's the bullish version and it's coherent.
But if today's profits are elevated, a high P/E understates the problem, because the denominator is doing you a favor that won't last. Price-to-sales declines to take a side on which of those is true. It only shows that price has outrun revenue, not merely that price outran a good run in earnings.
The gauge votes. The Buffett Indicator measures the same stretch against the economy and Tobin's Q measures it against replacement cost. Three denominators on the homepage, one answer, and the agreement is the part that's hard to explain away.