What the following ten years looked like
August 26, 2026
The overvaluation probability is 93% as of August 28, 2026, which we label Very High. That isn't a forecast about next month. It says ten gauges are sitting far out in the right tail of their own histories at the same time, which is unusual enough to be worth testing against the record.
So we tested it. For every month with a full decade of data after it, take the composite reading at the time and measure the annualized real return on the S&P 500 over the ten years that followed.
The buckets
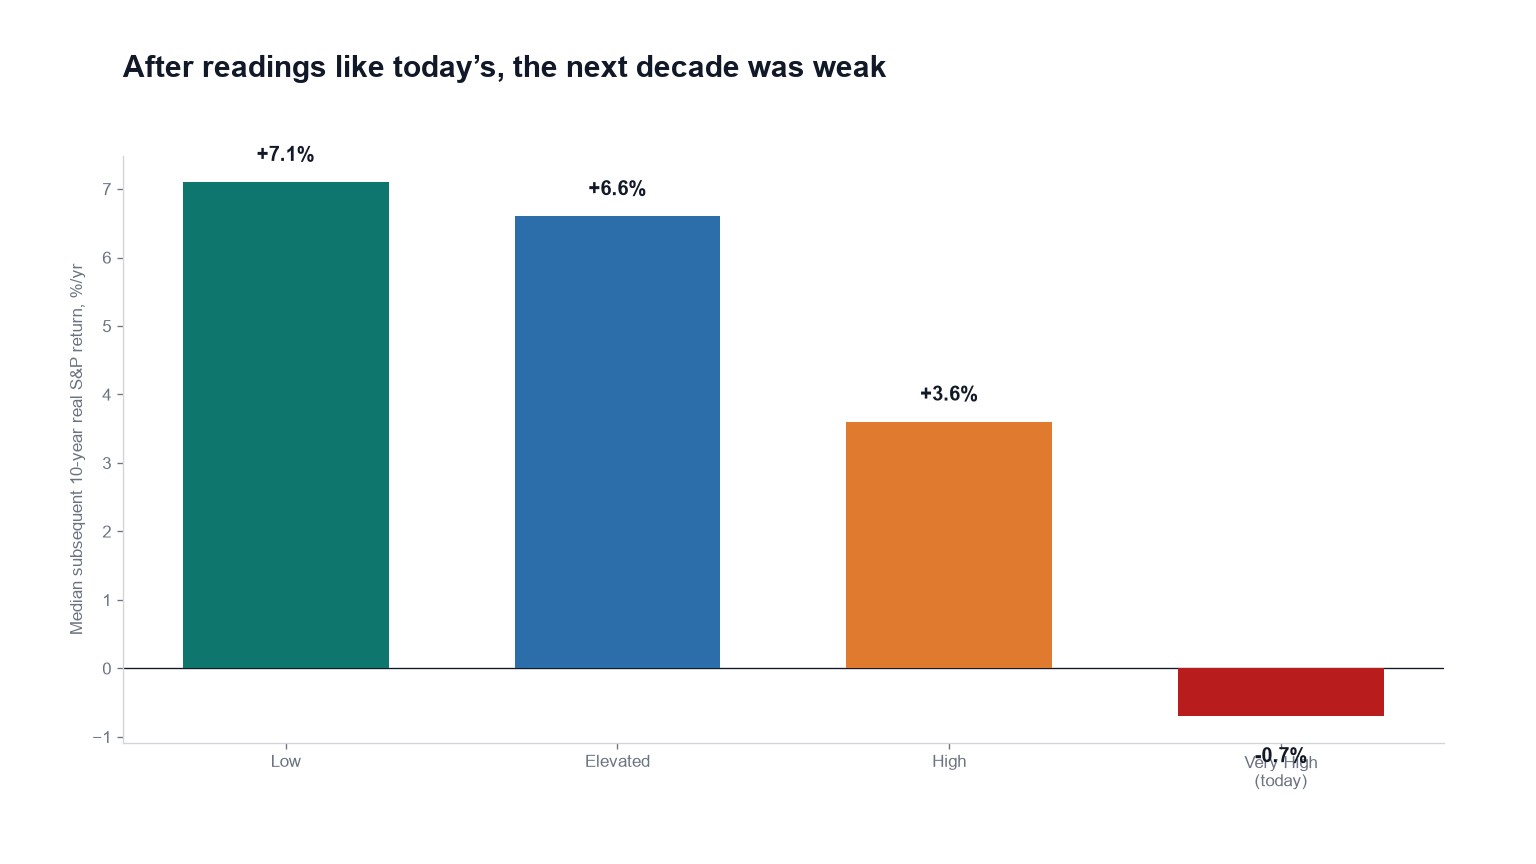
Decades starting from a Low composite returned a median 7.1% a year in real terms, and 5% of them finished negative. From Elevated, 6.6%, with 23% negative. From High, 3.6%, with 18% negative.
From Very High, which is where we are, the median decade delivered −0.7% a year, and 53% of them left investors with less purchasing power than they started with. Across all 759 months in the sample the median was 4.4%.
Read down the buckets and the gradient is consistent. Higher starting composite, lower returns, more losing decades. That gradient is the entire argument for caring about a 93% reading, and it only applies if your horizon is measured in years.
The caveats are substantial
The windows overlap heavily, so the 197 months in the Very High bucket are nothing like 197 independent decades. Treating them as independent would badly overstate how much we know.
The most recent ten years drop out of the sample by construction, because a decade that hasn't finished can't be measured.
And markets have stayed expensive for long stretches before any of this showed up in returns. The late 1990s cost early sellers three years of gains.
What survives all of that is unglamorous but durable. Paying a high price for future earnings has generally meant receiving less of them back. The relationship is about the price you pay, not about the timing of when the market notices.
The full table is on the overvaluation probability page.