The survey is not the market
September 9, 2026
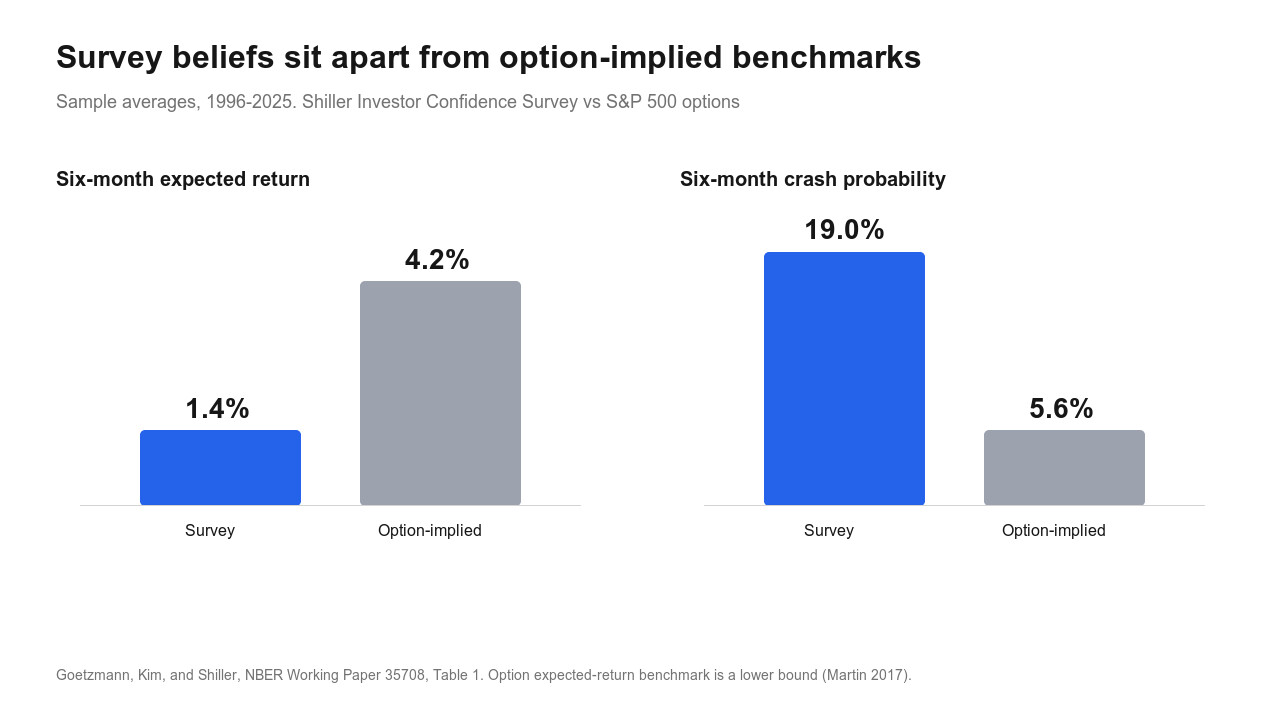
From 1996 to 2025, respondents to Robert Shiller's investor survey put the six-month chance of a crash at 19.0%. Options on the S&P 500, converted so both sides answer the same question, said 5.6%. The gap was positive every month.
William Goetzmann, Dasol Kim, and Shiller call that gap a composition wedge. The survey averages everyone who answered. Prices average the people still bearing the risk. Those are different groups, and the people who stepped out are the more pessimistic ones. Their six-month expected return averaged 1.4% against an option-implied 4.2%. This is a working paper, and participation is a survey answer ("I advise being less invested"), not an observed holding.
Crash beliefs decide who stays
Most participation models fold crash fear into the expected return. Hold that return fixed and who stays in shouldn't change. The respondent-level answers say otherwise. A one-point rise in the crash-probability spread lines up with a 0.34-point rise in the share advising others to be less invested, after expected-return beliefs are controlled for.
That selection is why a high survey expected return has tended to precede a low realized return. Greenwood and Shleifer documented the pattern. This paper splits the survey number into the part prices already reflect and the part they don't. The negative forecast lives in the part they don't. When the fearful leave, risk concentrates on a smaller pool, and the remaining holders require a higher premium. The survey still counts the people who left.
The option expected-return benchmark is a lower bound, so the return wedge understates the distance. The survey also mails high-net-worth and institutional investors, not the Z.1 household universe.
Measure the gap, not the mood
We already run two sentiment gauges that keep those populations apart. The VIX is what the pricing population pays for crash insurance. Household equity allocation is what households already own. A single investor-confidence index would mash both groups back together and call the mash a mood.
What we would add to the sentiment row is Belief Dispersion: the survey expectation minus the option-implied expectation, on returns and on crash odds. The crash-probability spread's correlation with the VIX is −0.032. Both legs of the spread move with volatility. Their difference does not, so this would not be a second VIX.
The respondent-level series is not a FRED print we can refresh before the open, which is why this is not on the overvaluation probability yet. The thing worth tracking is not how confident investors say they are. It is how far that answer sits from the price of the same bet.