The same rate move is not the same signal
September 10, 2026
The usual story is an inverse. Yields fall, the discount rate falls, stocks are worth more. Yields rise, and the multiple should compress. That is how people have read the 10-year against equities for a decade, and it is the arithmetic inside our own interest rate model: stock position minus rate position, both in z-scores.
Olivier Wang's August 2026 NBER paper, Rate Risk and Rate Insurance, is an argument that the inverse is only half the object. A stock is a claim on payoffs and an implicit long bond. Which half is doing the work depends on why the yield moved.
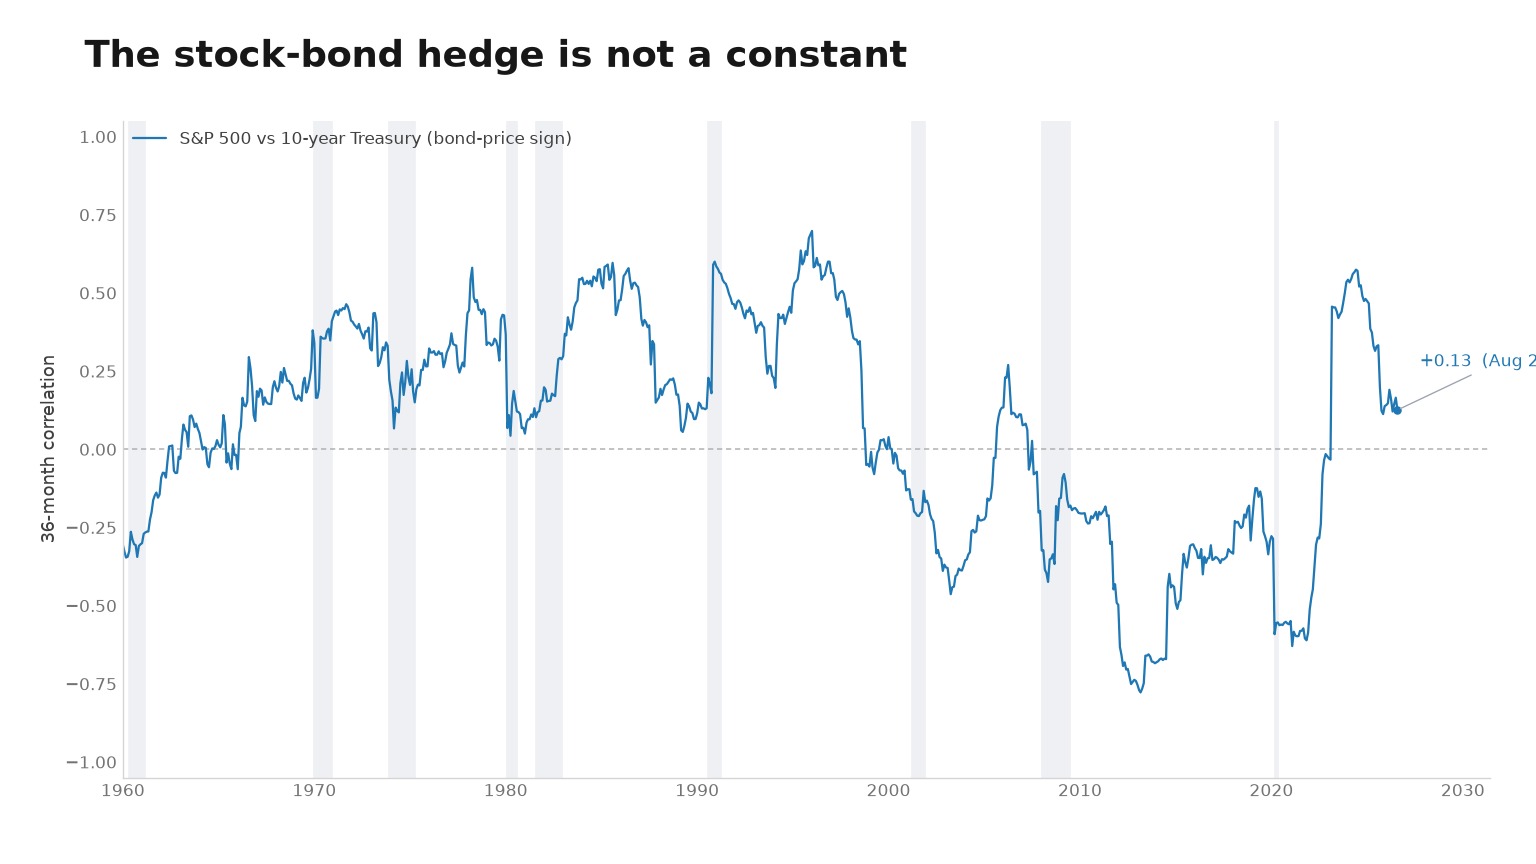
The bond inside the stock
Wang splits each stock return into two pieces. One is the return on a duration-matched Treasury, identified from FOMC surprises so the rate move is not just payoff news in disguise. The other is a residual payoff piece — the cash-flow news, roughly the return on a book of dividend futures.
The first piece is rate risk. Longer duration means a larger capital gain when yields fall, the same way a 30-year zero moves more than a 2-year. The second piece is ordinary equity risk.
Those two pieces do not add. They often subtract. When bad payoff news arrives, rates tend to fall — recession, a growth scare, a flight into Treasuries, the Fed easing into weakness. The bond sitting inside the stock then rises, which cushions the hit from the cash-flow news. Wang calls that offset rate insurance.
It works in reverse on the way up. Good growth or inflation news lifts payoffs and lifts yields. The implicit bond loses value just as the equity claim is doing well, so some of the gain never shows up in the price. That is why, in his sample, stock volatility and returns rise much less with duration than they do for the matched Treasuries. The 10-year's rally from 1988 to 2019 paid long bonds handsomely. It did not pay long stocks the same way.
The aggregate market's estimated duration is 19.6 years. Its matched Treasury earned about as much as the market itself. At the long end, the insurance is strong enough that long bonds can beat long stocks.
One yield, two regimes
This is the part that maps onto the interest rate model.
The model treats every move in GS10 as the same kind of input. Low rates support high stock prices; the composite is S&P z minus rate z. A negative slope on the scatter is the usual inverse. That is the right average, and it is the story we told when the rates argument ran out of rates.
It is the wrong story for a given week. A yield that falls because growth just died is insurance: the bond inside the stock is paying out while earnings news is bad. A yield that falls because the inflation premium came out of the curve is a classic discount-rate cut, and it should support a higher multiple. Those two 50-basis-point declines look identical on GS10 and opposite in what they mean for equities.
The same split applies on the way up. A growth or inflation shock that lifts the 10-year is not automatically a reason to cut the multiple. Part of that higher yield is the market saying payoffs got better. A term-premium shock that lifts the 10-year with no growth attached is closer to the inverse the model assumes.
Wang's other implication is policy. Fiscal debt and the Fed's reaction function change how strongly payoff news moves rates, which changes how much insurance stocks carry. The stock-bond covariance is not a fixed property of the two assets. It is a property of the regime.
What the gauge should do next
We should stop reading the 10-year as a simple inverse input to equity valuations. The live composite can stay. What it needs is a split of the rate move that produced it.
Two kinds of shock, at minimum:
- Inflation or growth. Yields and payoffs move together. Rate insurance is at work. The usual "rates up, stocks should be cheaper" reading overstates how expensive the market is, and "rates down, stocks are justified" overstates how cheap it is.
- Recession or flight-to-safety. Yields fall as payoffs worsen. The implicit bond is paying the insurance. The current subtraction is closer to the right one. A term-premium shock with no growth attached belongs in this column too: the inverse is doing what the textbook says.
Excess CAPE Yield has the same problem in a different unit. It subtracts a real bond yield from an earnings yield. It does not ask whether that real yield moved because expected growth fell or because a risk-off bid flattened the curve. The two gauges can keep disagreeing. They should also start agreeing on the kind of rate move they are looking at.
The yield curve and Sahm already tell us something about which regime we are in. They do not vote on valuation, and they should not. They can still label the rate shock that the valuation gauges are subtracting.
Until the model does that split, a high composite still means stocks are high given where the 10-year sits. It does not mean we know why it sits there. Wang's paper is the case that the why is the trade.